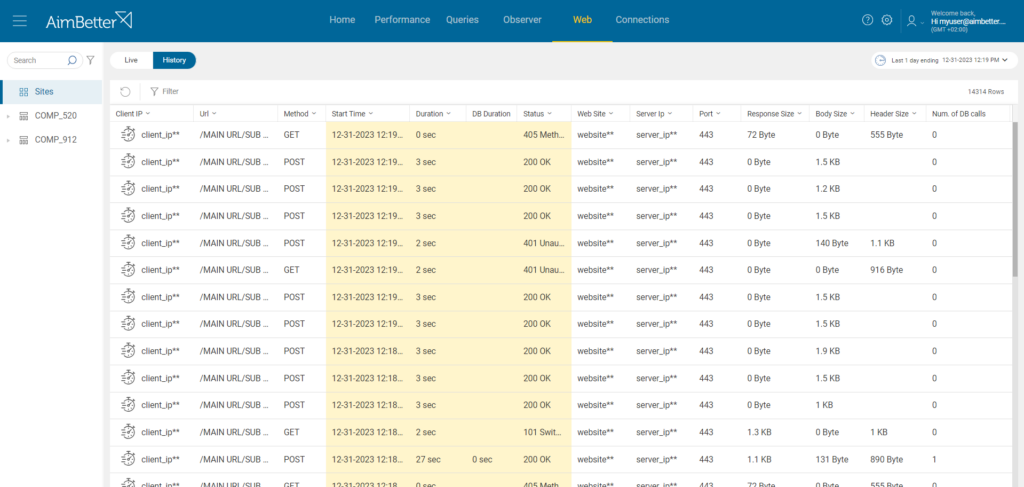
AimBetter tracks and analyses a full range of metrics related to the web server activity to ensure that all content is delivered quickly and intact.
In this module, you are able to see the information on each page request:
- Client IP – The incoming IP.
- URL – The page URL.
- Method – the method in which the request to the URL was made, POST or GET.
- Duration – the time it took to reach the page.
- DB Duration – the time spent with database-related activities.
- Status – The status of the request. This is returned with either the “OK” response (200) or the relevant standard error code (e.g., 400 – Bad request, 404 – Not found, 500 – Internal server error, and more)
- Web Site – the website to which the page belongs.
- Server IP – the server’s IP to which the requests are sent.
- Port – the Port used by the IIS to send and receive data.
- Response Size – the total size of the response in bytes.
- Body Size – the size of the response body in bytes.
- Header Size – the size of the response header in bytes.
- Num. of DB Calls – the number of times the IIS application makes some database-related action.
— Live
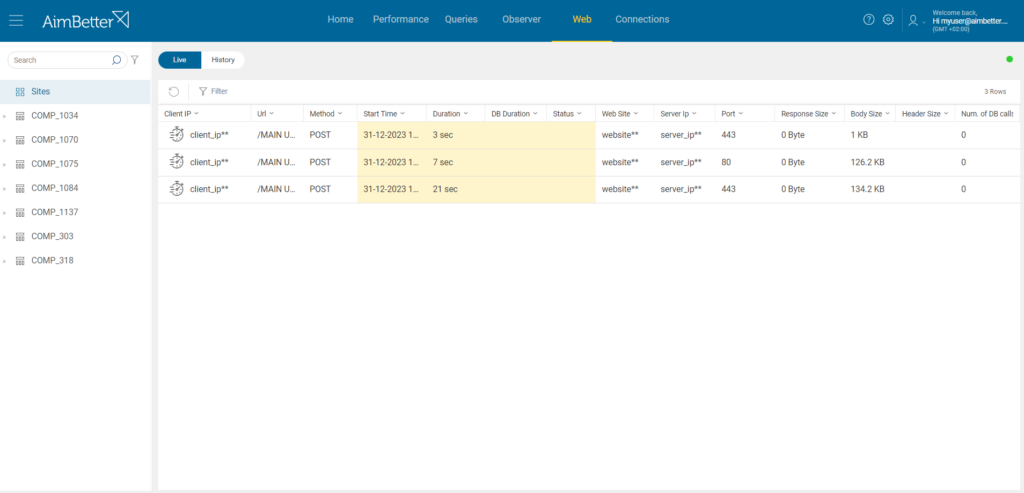
In the Live view, the requests running at the current time are displayed. The moment a response for a specific request is received, this request goes from the Live to the History view.
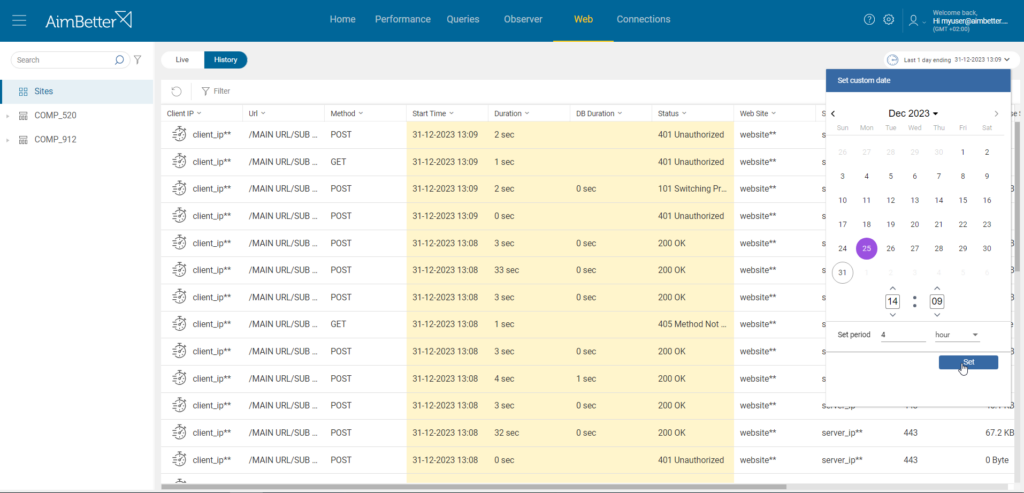
— History
On the History View, all the pages are displayed for the selected period in the calendar on the upper right side. The default period is the last day, ending at the current moment.
—-Calendar
To change the period, go to the “Calendar Bar” on the upper side of the screen. You may change the end time by picking the day on the calendar, and the end time on the Hours: Minutes display. For the period length, choose the desired number of minutes/hours/days or weeks beside the “Set period” label and click on the “Set” button.
—-Sort
You may also sort by column values by clicking on the little arrow beside the column name and choosing ascending or descending order.
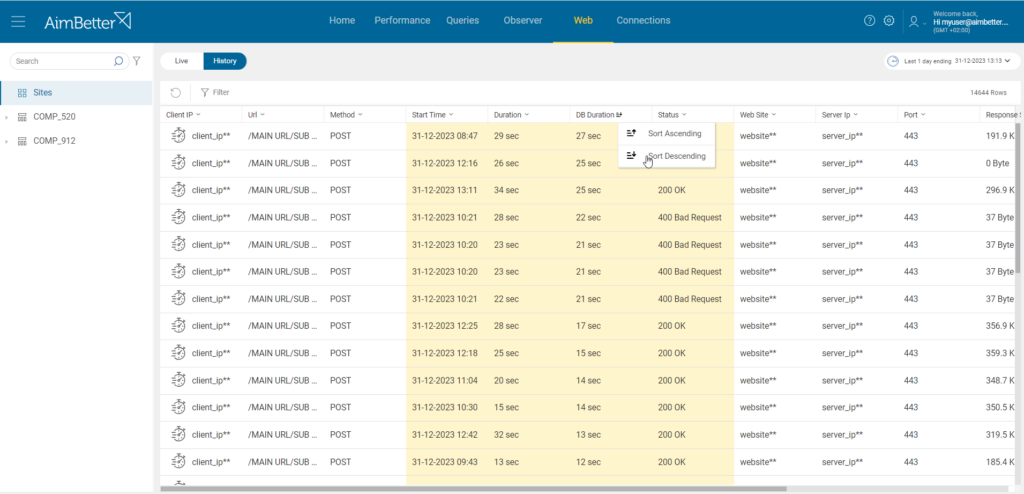
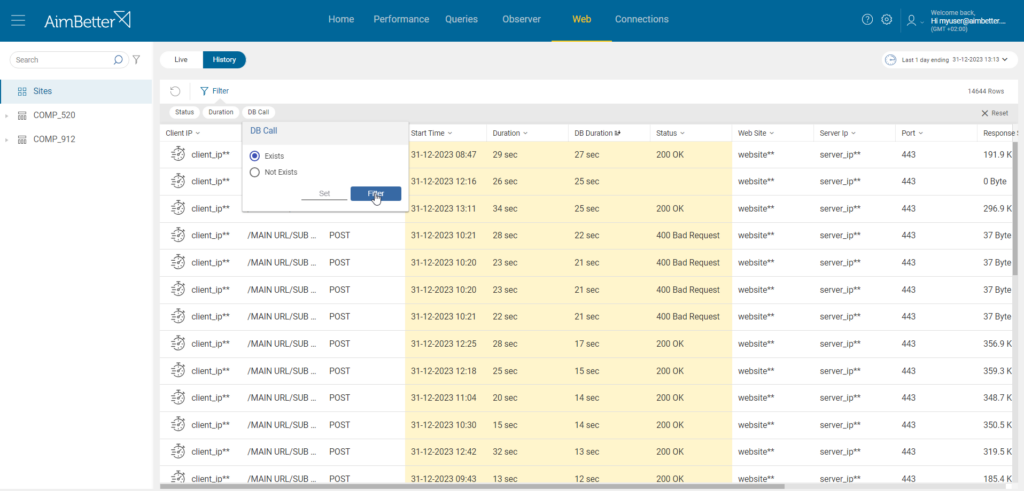
—-Filter
There is also the possibility of filtering the pages by their Status, Duration, or DB Calls.
— Request Details
By clicking on any of the web server requests, more details about this request are presented on the bottom part of the screen.
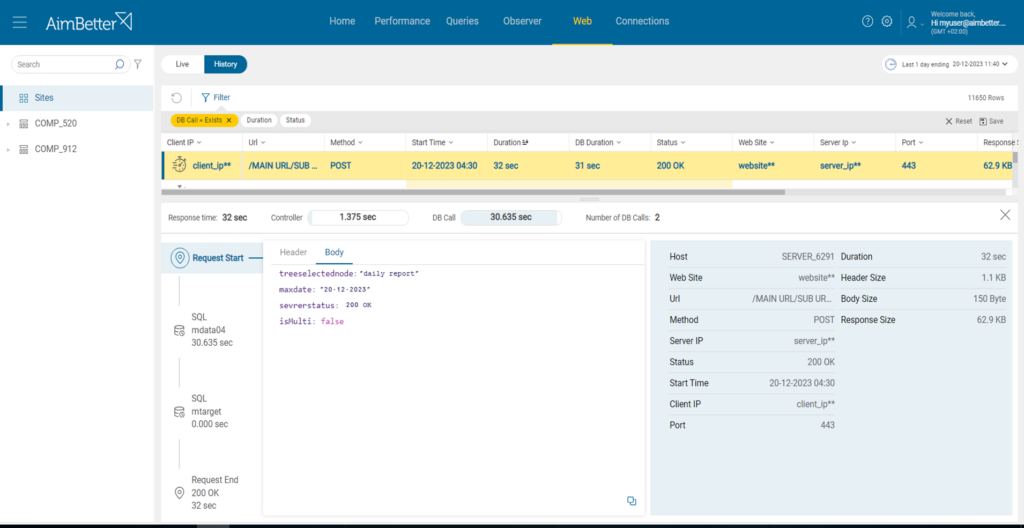
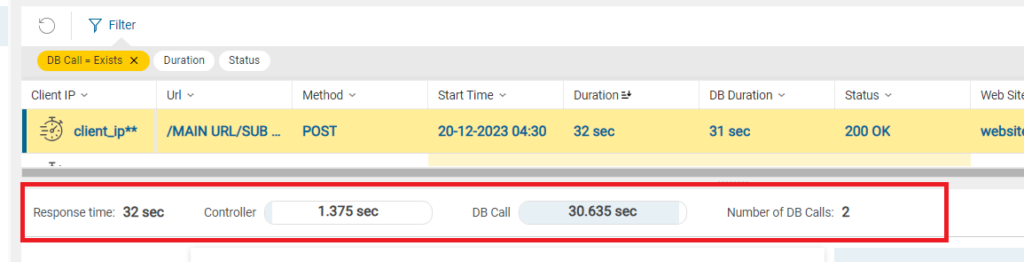
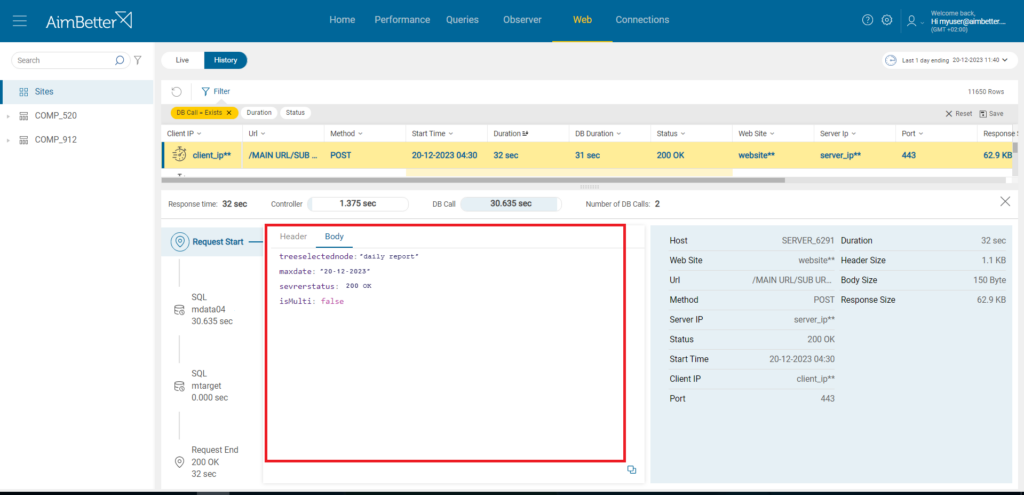
On top of this request detailed view, there is a summary of the total time to get the request’s response – “Response Time”, the time spent by the request with database-related activities – “DB Call”, the time spent with non-database-relate activities – “Controller”, and the number of times the request made some database-related activity – “DB Calls”.
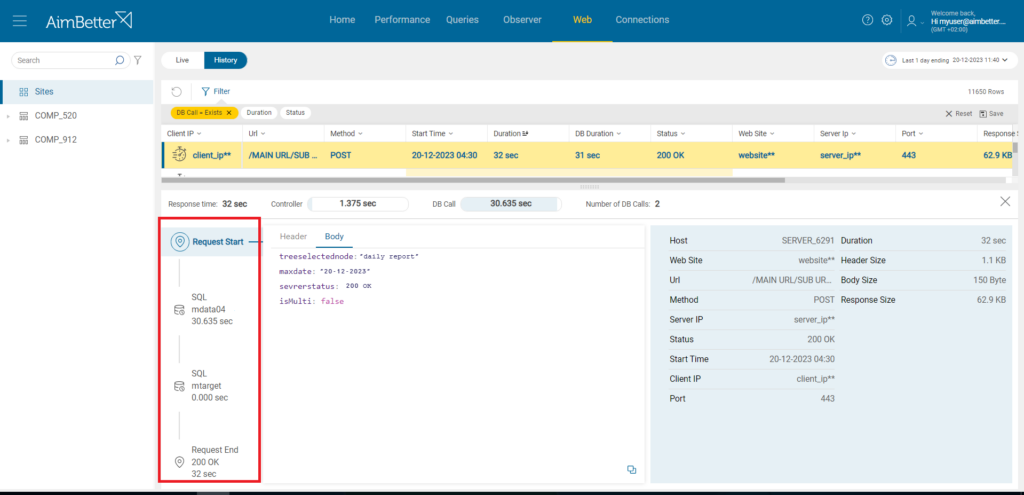
On the left side of this detailed view of the request, you can find a schema of the request flow, from its start – “Request Start” until its end – “Request End”. If there are any database-related activities – “DB Calls” – these will be displayed on the request flow – “SQL” – with the correspondent database name. The duration of each DB Call is also displayed beneath the database name.
In the central part of the request detail view, when the Request Start is selected, click on the Body view to see information about the request body.
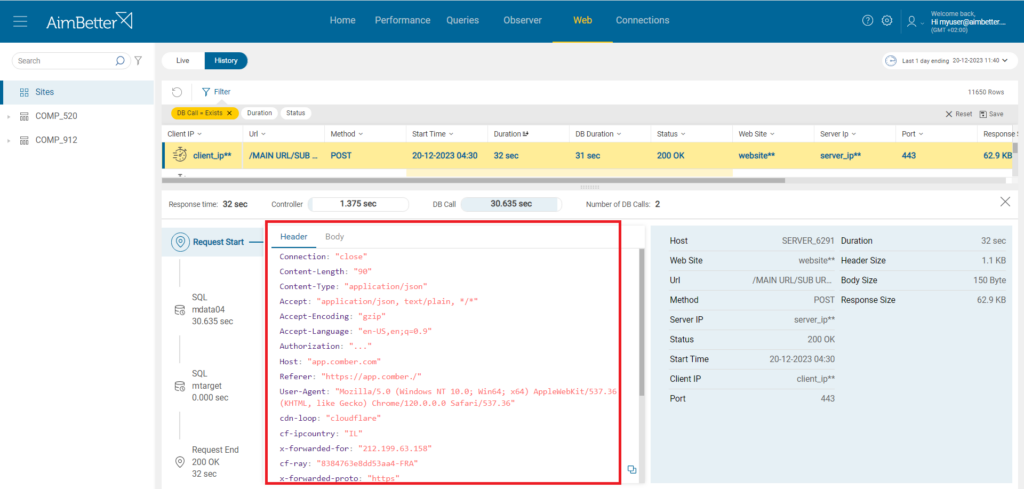
Click on the Header view beside the “Request Start” to see information about the request header.
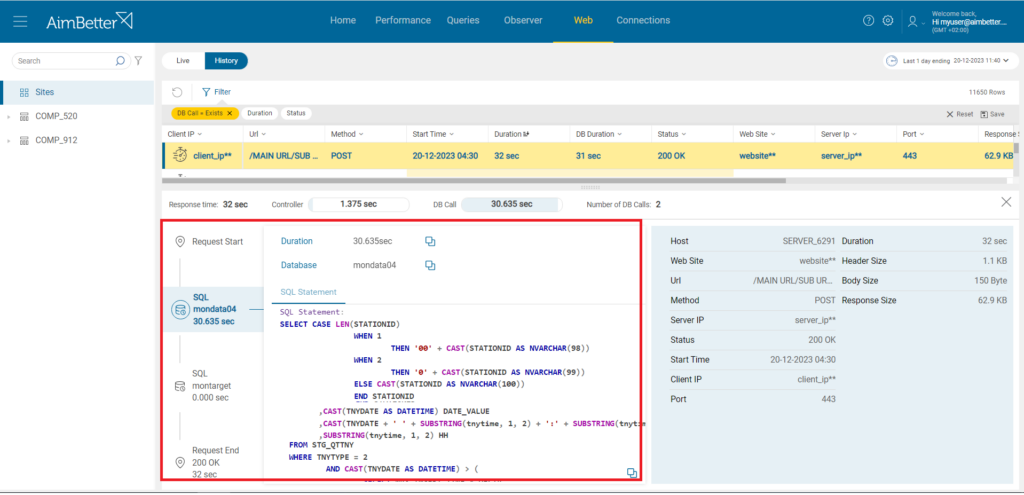
When selecting one of the SQL nodes on the left side request flow, the query related to this DB Call will be displayed on the central part of the request details window.
— Web Server Performance Tabs
You can find further information about your web servers in the Web Server tabs – App Pools and Web Sites – which are part of the Performance module.

 +1 (650) 449-8622