The Observer module displays information about events in the server’s environment, such as exceptions, backups, deadlocks, and general changes.
Overview
The first tab, “Overview,” summarizes all this information in a clear dashboard with graphic views that display the summaries along a selected period. The default period is the last day.
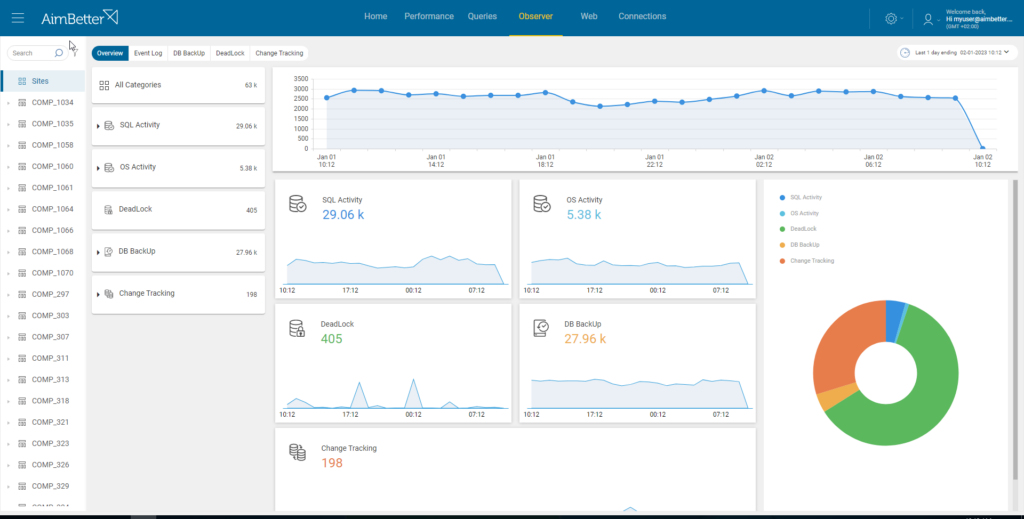
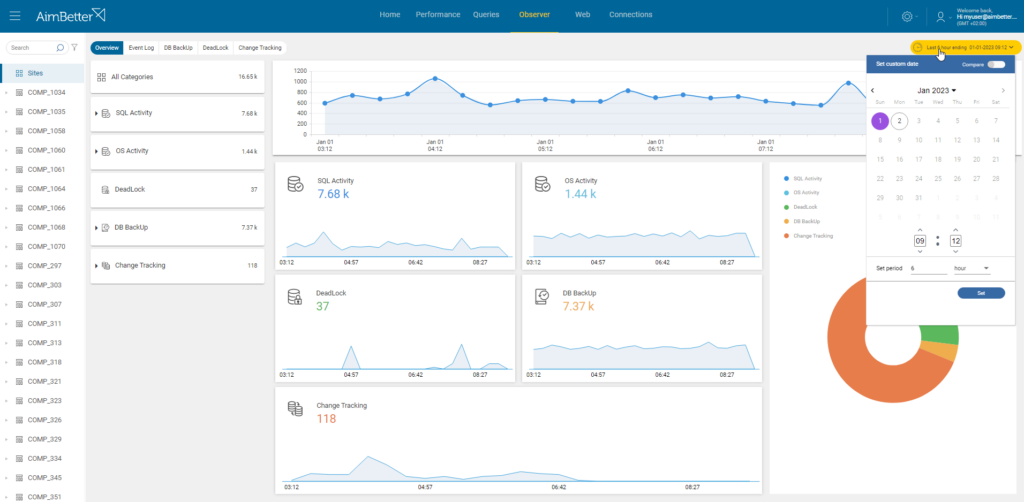
The period can be changed by clicking the “Calendar Bar” on the top right of the screen.
Clicking on the “Calendar Bar,” a calendar will pop up so you may select the endpoint time and the period to display the summaries for this selected period.
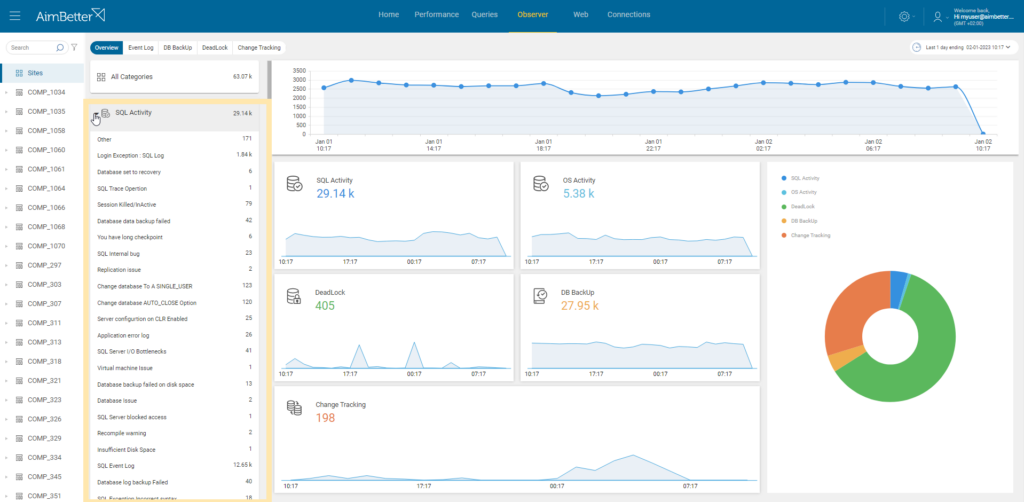
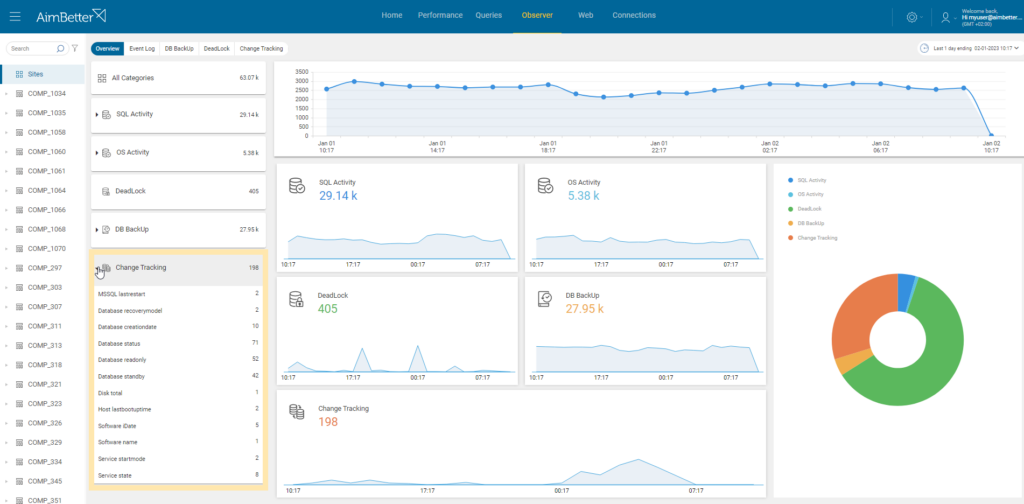
Clicking on the little arrow beside “SQL Activity,” a list of all the SQL-related exceptions will be displayed with the count of each one of them.
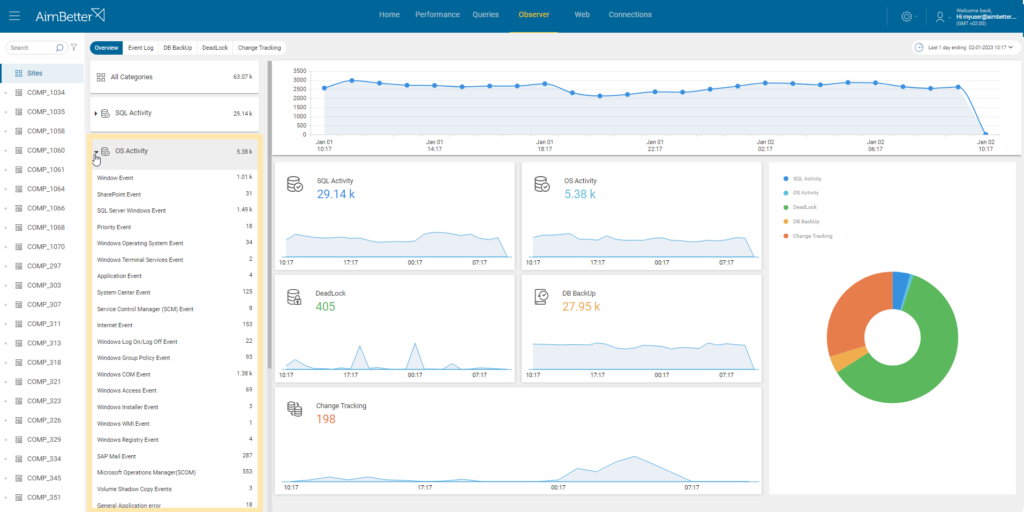
The same applies to OS Activity, which will display OS-related exceptions and their count.
The same to the Backups, their types, and counts and Deadlocks count.
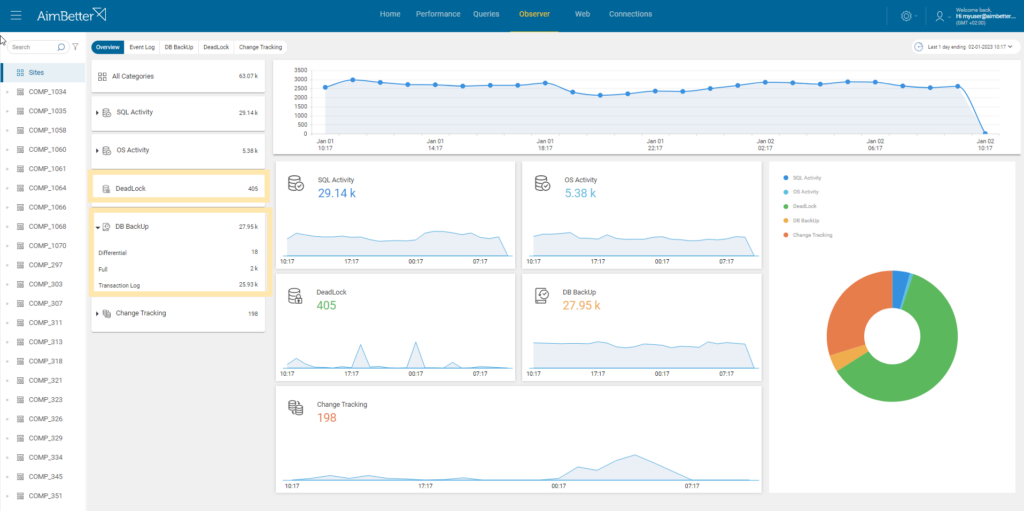
And finally, all the changes with their counts, including installations, database creation, service change of status, updates, and more.
Event Log
The Event Log tab displays all the servers’ environment exceptions.
It is possible to choose between two different views:
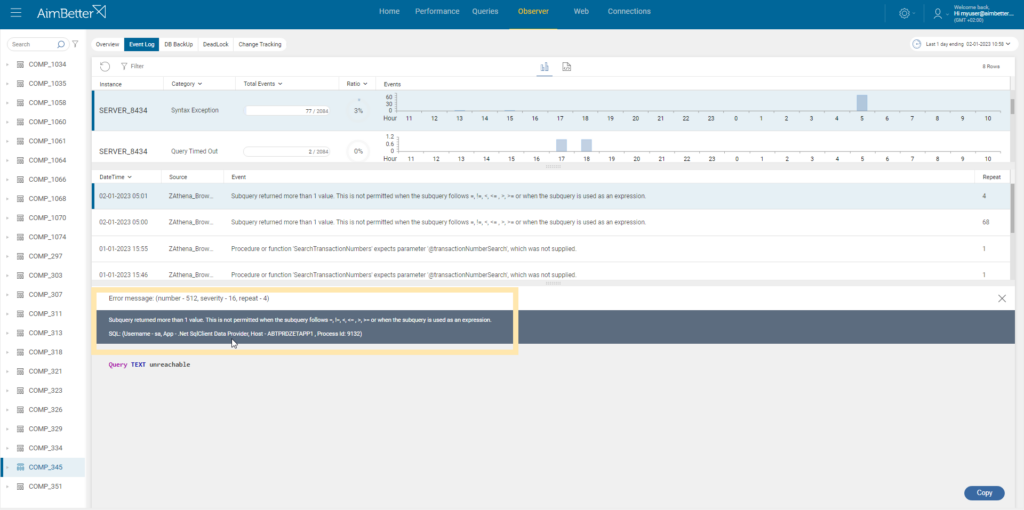
1- Graph View
In this view, each row represents a specific Exception category of a specific Instance.
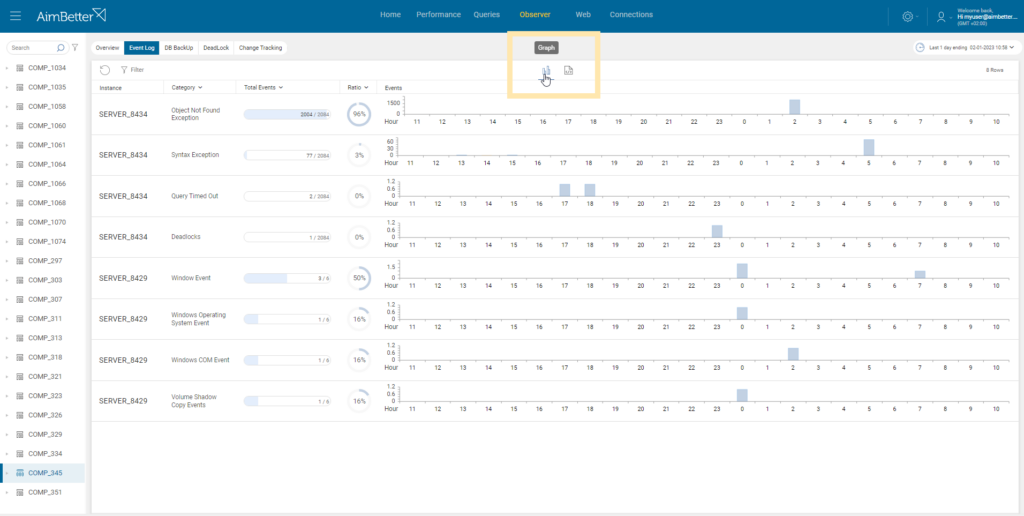
The graph shows how many times this event happened each hour, considering that the selected period is the default one day.
Clicking on the row, a window is displayed on the bottom part of the screen, showing each log of this exception category.
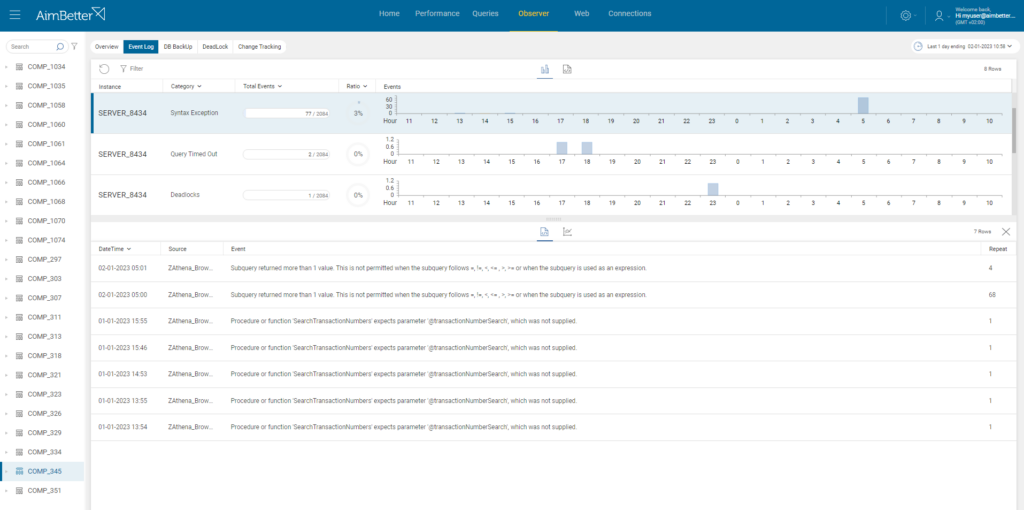
Clicking on one of these logs will open a new window with specific information on this occurrence, including the username, application used, and process id.
With this information, it is possible to discover users responsible for all kinds of issues in a few clicks and save a lot of time that can be used to solve problems!
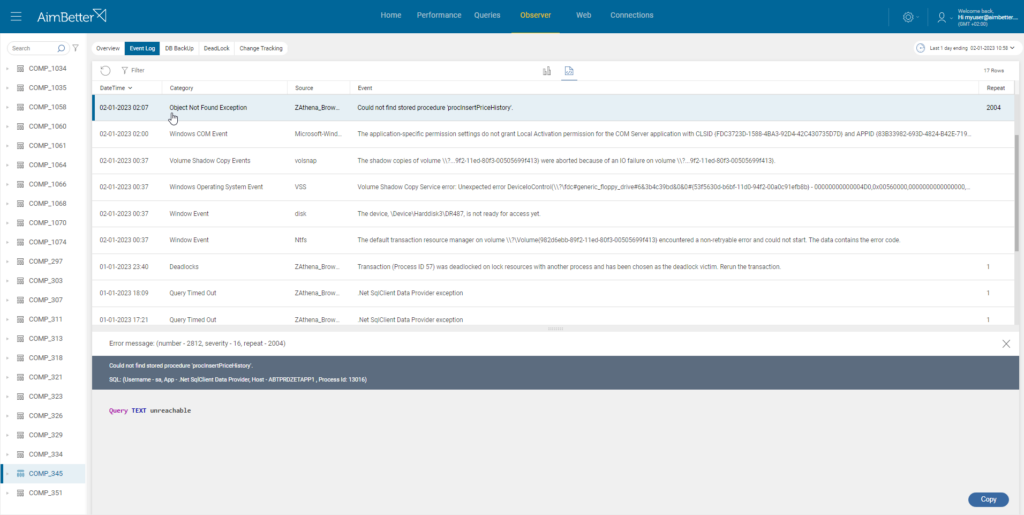
2 – Log View
This view displays all the logs by their time.
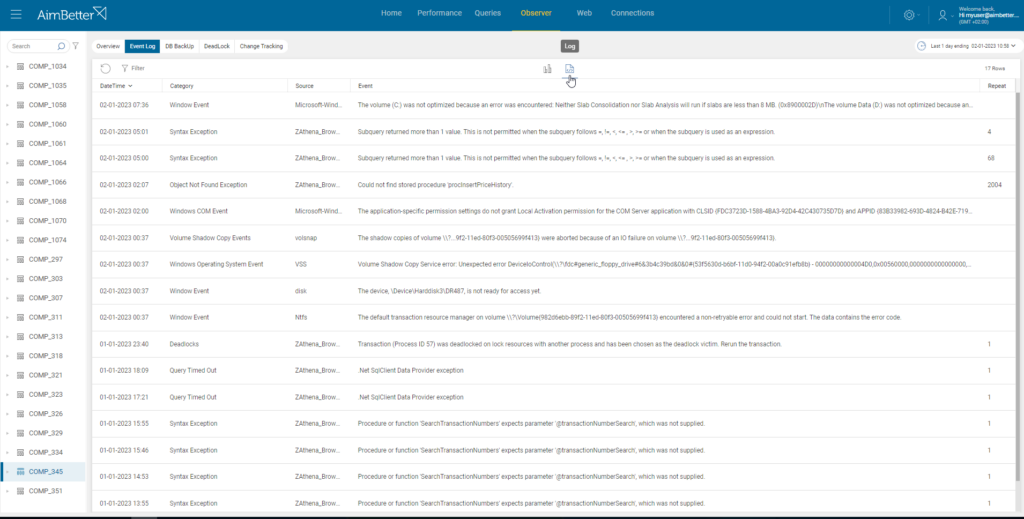
In the same way, clicking on a specific row shows the information on this occurrence, including the username, application used, and process id.
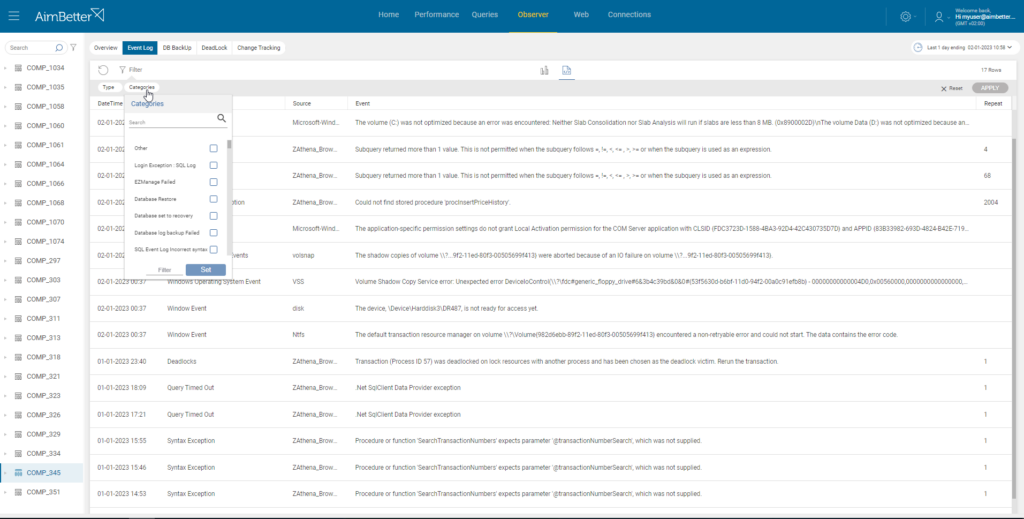
In both views, the logs can be filtered by Type (SQL or OS Events) and Category.
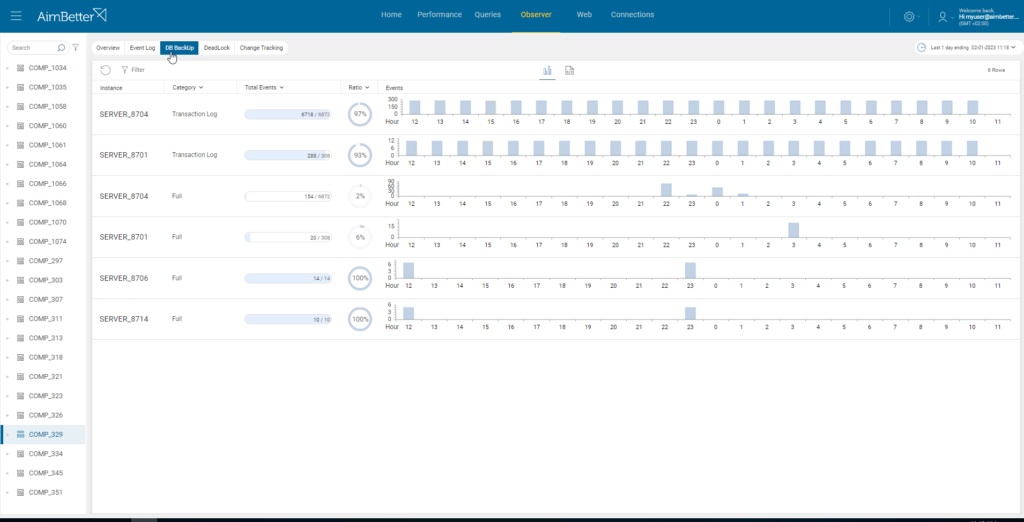
DB Backup
The DB Backup tab displays information about the instances’ backups in the selected layer by type (Full, Transaction Log, Differential).
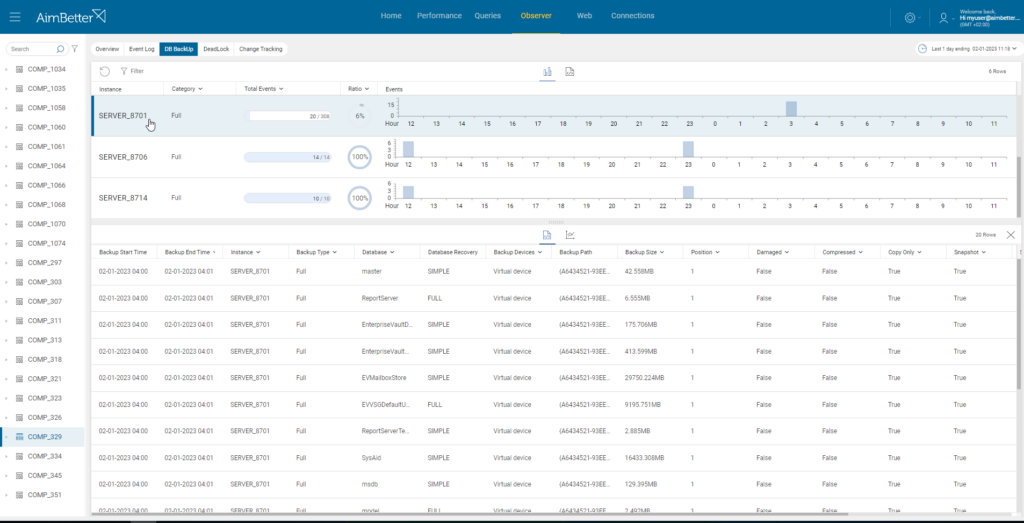
Clicking on a specific row will expand the logs of each backup event of this type and in this server. Each log shows information about the backup, like database, time, device, path, and more.
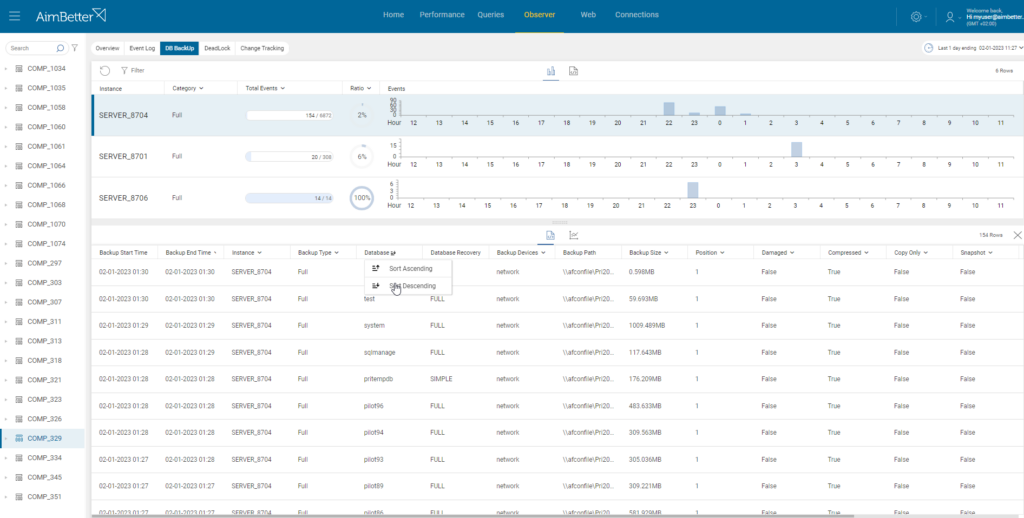
You can sort the column in ascending or descending order on the columns with a little arrow beside it.
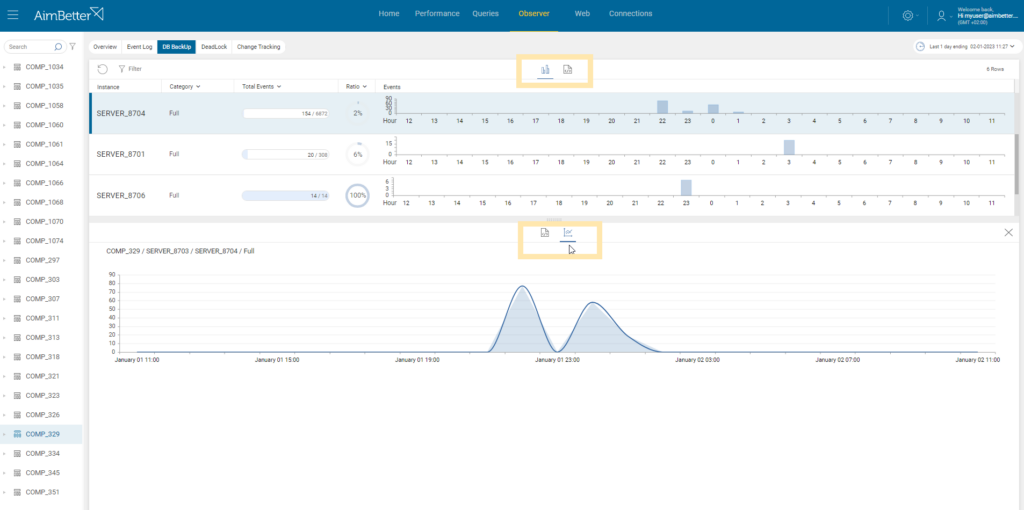
And as in the Event Log tab, there is an option to choose between graph or log views.
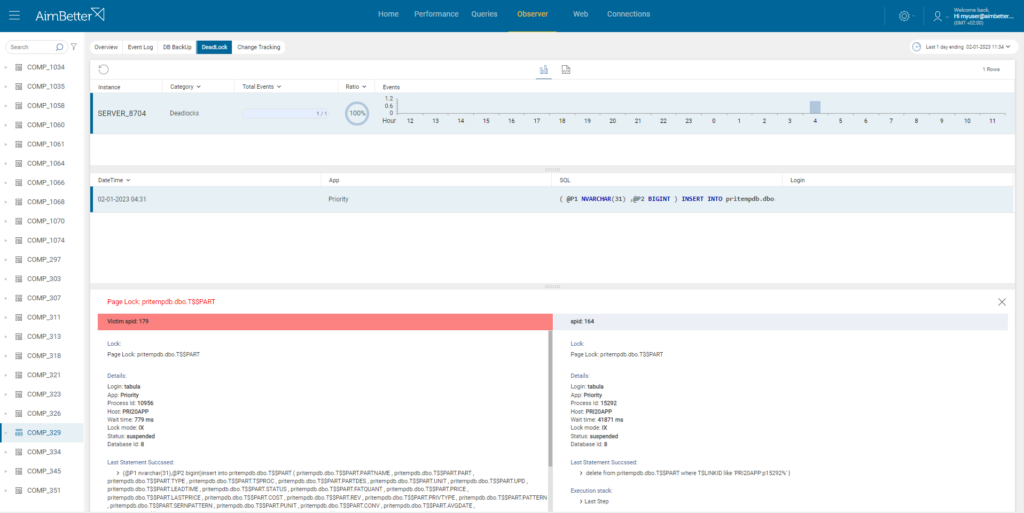
Deadlock
This tab presents information about deadlocks on the system.
Deadlock is created in a mode of interoperability between two processes that attempt to perform an update operation (Insert, Update, Delete) on the same object (index, field, record, table) at the same time.
In this mode, the Operating System selects one of the processes as the victim and effectively stops it until the second process is completed and releases the resources in its possession for other processes.
You can click the desired event and see a window below with information about the victim (on the left column) and the query that finished its process. (on the right column).
The events are also clickable and will expand further with information:
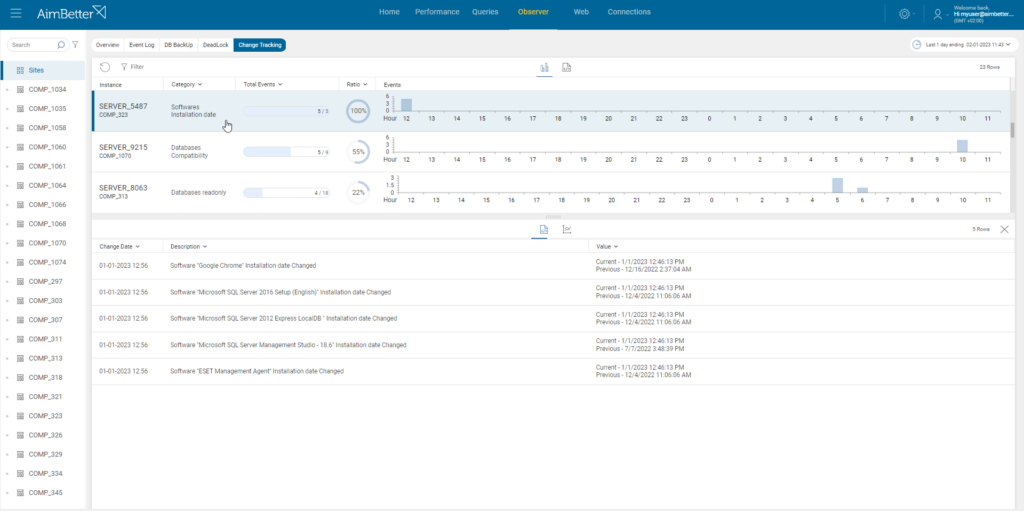
Change Tracking
On this tab, you can see information about changes on the server.
Change tracking alerts may be about: the start/stop of services, software installations or updates, database creation/deletion or updates, disk additions, network configuration changes, and more.
As in other sections, more information is revealed once clicking on the event:

 +1 (650) 449-8622