This module shows the different aspects of the monitored servers and instances and is divided into Tabs that show useful information on your systems’ different resources.
There are some common features to all the Performance Tabs, which can be seen in the following image:
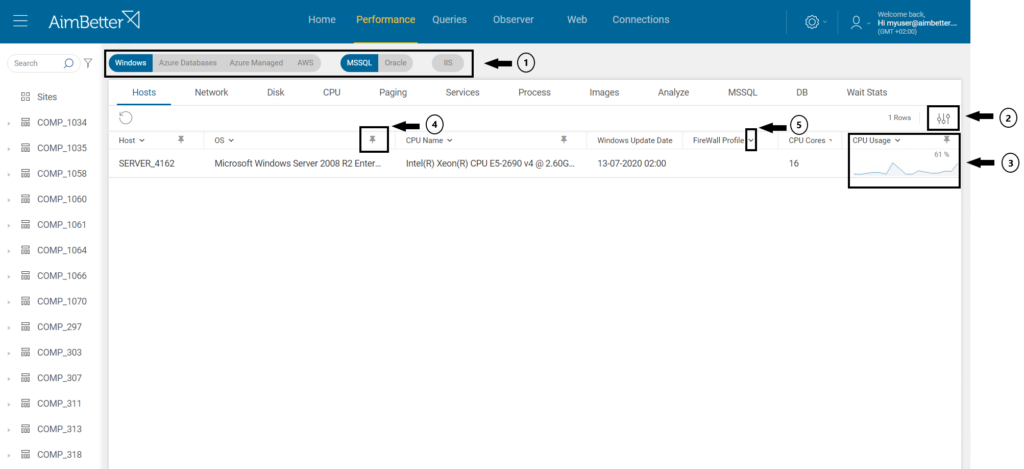
Platforms bar
Using this bar, you can quickly filter the view to show only the servers of the selected platform. The platforms displayed depend on the servers being monitored.
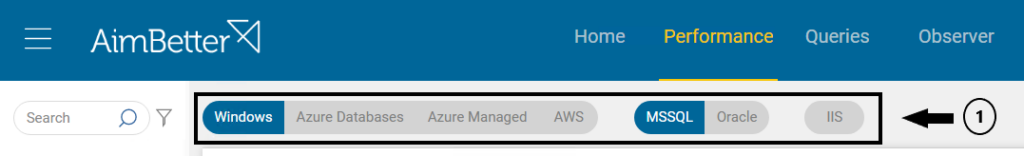
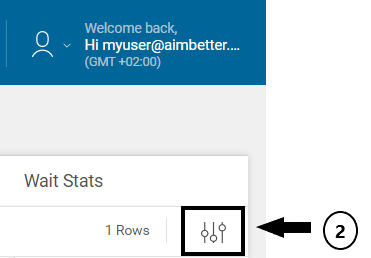
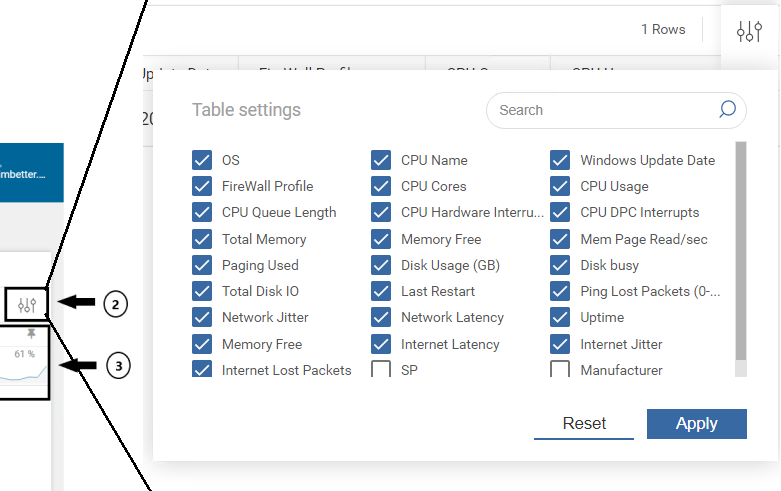
Table Settings
Default columns are displayed for each tab in the Performance module.
You can add more data by clicking the “Table Settings” icon at the top right and selecting the metrics you want to add. Click “Apply” to display the selected columns or “Reset” to return to the default column configuration.
Notice: This “Table Settings” won’t be visible while some graphs are open/expanded (see next session). You must close all the graphs to see it.
Graphs
The performance metrics graphs can be clicked and expanded.
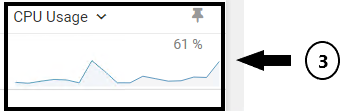
For example, if we click on the CPU Usage graph, this is how the graph will be expanded.
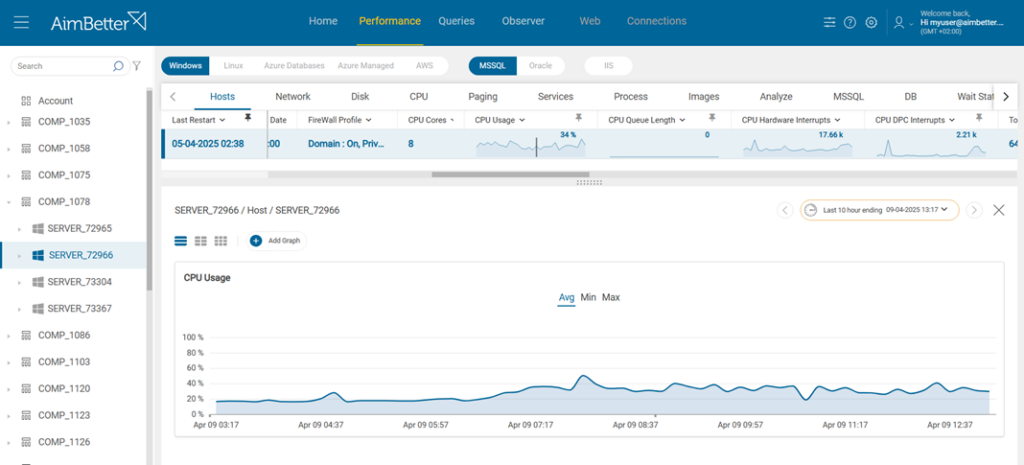
Above the graph, click on “Avg,” “Min,” or “Max” to display the average, minimum, and maximum values of this metric over the selected time.
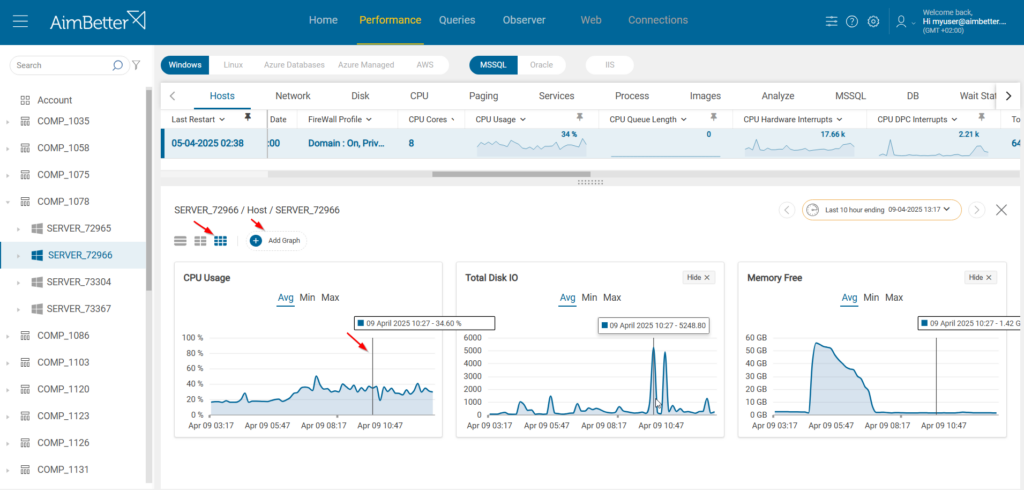
You can click the + “Add Graph” icon and choose another graph from the available metrics on this Tab. Then click “Apply,” and the graphs will be displayed one per row. You can change the layout by clicking on the icons beside the “Add Graph” icon to display the graph side by side – two or three in a row.
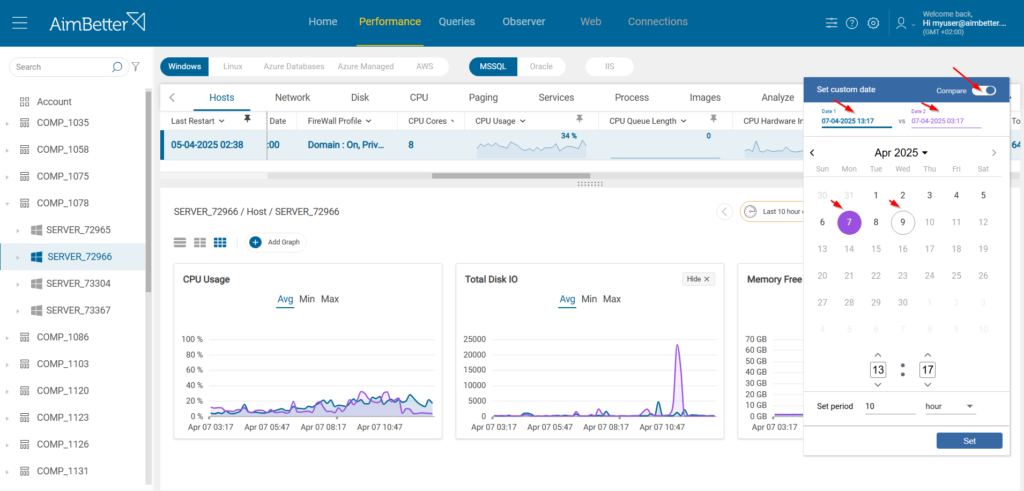
In the “Calendar Bar” in the upper right side of the graphs, you can click and choose another end time point and period for the graphs. Click on “Set” to receive the graphs for the new time.
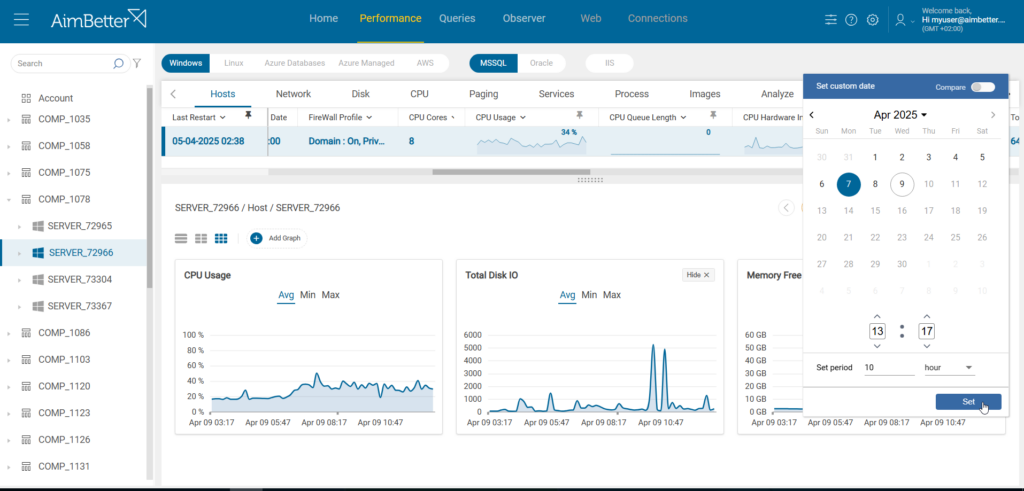
Still, in the “Calendar Bar,” you can toggle the “Compare” button and set 2 different days for comparison, as shown below.
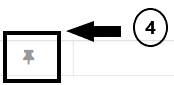
Pin Icon
The “Pin Icon” is used to pin the columns you want fixed in each tab view.
Sort Icon
The “Sort Icon” is used to sort the selected column in ascending or descending order.
Next, we’ll focus on each Tab, which refers to some server environment resource.
Windows Tabs
From Hosts to Analyze, these tabs relate to Windows Operating System resources.
➣Hosts
This tab shows general information about the Operating System level of the selected server, such as CPU Usage percentage, Total Server Memory, how much Free Memory remains, and the server’s Last Restart.
Click here for the description of each metric on this Hosts Tab.
➣Network
This tab shows the server’s network information, such as the Network Card details, Bandwidth, and Network Traffic levels.
Click here for the description of each metric on this Network Tab.
➣ Disk
This tab shows information about storage Disks, Used Space and Total Space, Free Space, how busy they are at any given time, Read/Write, and IO levels.
Click here for the description of each metric on this Disk Tab.
➣ CPU
This tab shows the level of CPU Core Usage, the Number of Cores, and other core-related metrics.
Click here for the description of each metric on this CPU Tab.
➣Paging
This tab shows Page file information, including physical location, how much it is used, size allocated, and more.
Click here for the description of each metric on this Paging Tab.
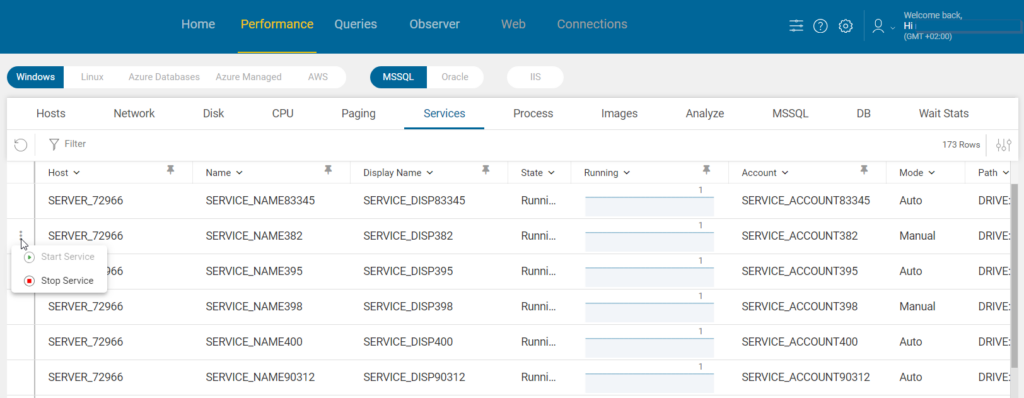
➣Services
This tab shows the services running, their mode (manual or automatic), status (running or not), account, path, and more. The graph in this subtab shows 1—Up/Running or 0—Down/Not Running over the selected period.
Click here for the description of each metric on this Services Tab.
Stop or Start a Service
If the Responsive Agent feature is enabled, you can stop or start any service by clicking on the three dots that appear on hover on the left side of the service line.
➣Process
This tab shows information about the different processes running on the server.
You can see their CPU usage, how much memory they consume, Page file usage, details of the calling process, and more.
Click here for the description of each metric on this Process Tab.
Kill Process
If the Responsive Agent feature is enabled, you can kill any process by clicking on the “Kill Process” icon that appears on hover on the left side of the process line.
A confirmation message will appear when clicking the “Kill Process” icon, and a code will be requested. This action is performed only if the correct code is provided.
➣ Images
This tab shows information about the number of processes running under the Image. This is usually relevant for terminal servers or terminals running multiple processes of the same type. The information is represented in MB.
Click here for the description of each metric on this Images Tab.
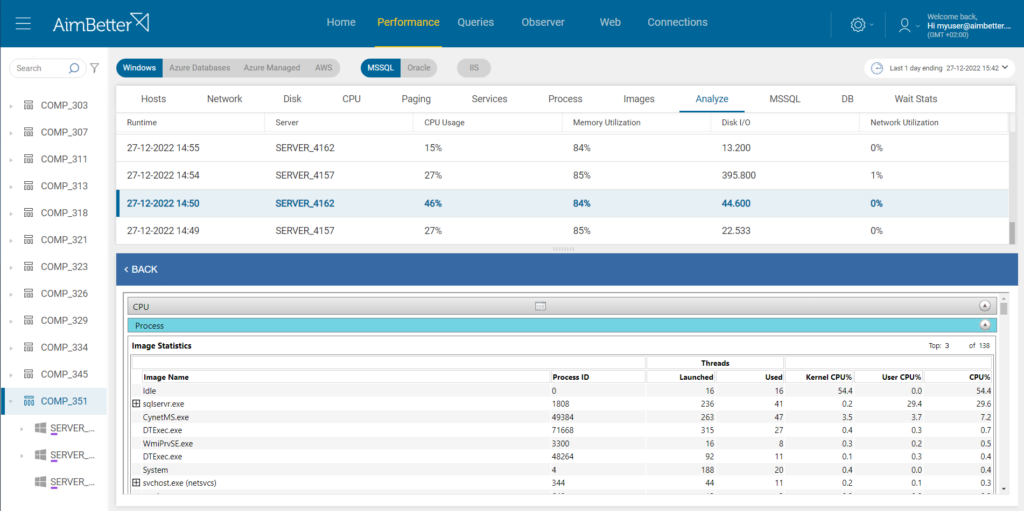
➣ Analyze
This tab is useful for investigating and analyzing issues such as busy disks or high CPU usage.
It shows logs every 5 minutes for 1 1/2 hours, and the end time can be switched in the “Calendar Bar,” as explained in the Graphs session.
Each row is clickable, and upon clicking it, an expanded window with additional fields opens below. Those fields are also expandable once you click on them.
In the following example, we clicked on the Process under CPU to investigate the processes responsible for most CPU usage.
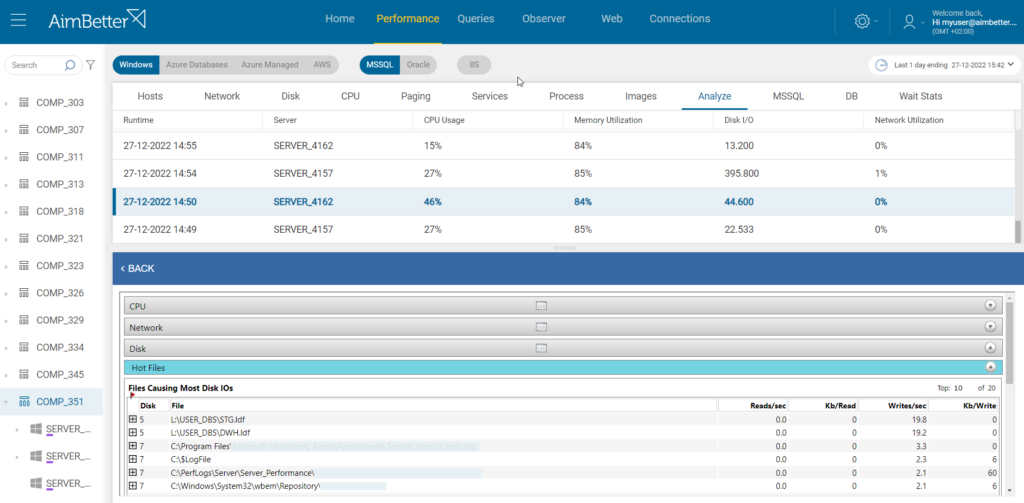
In this other example, clicking on “Hot files” expands a drop-down window with information about which files are causing more disk I/Os, from which disks, their read and write processes, and more.
➣MSSQL on Windows
For MSSQL Servers, this subtab will display details about the MSSQL instance, such as the SQL version, its service pack, the last restart, the amount of memory allocated for the SQL, the number of cores available, and in use, the time to establish a connection, and more.
Scroll right to see all more metrics. Click on the Columns Button to select which metrics to display.
Click here for the description of each metric on this MSSQL Tab.
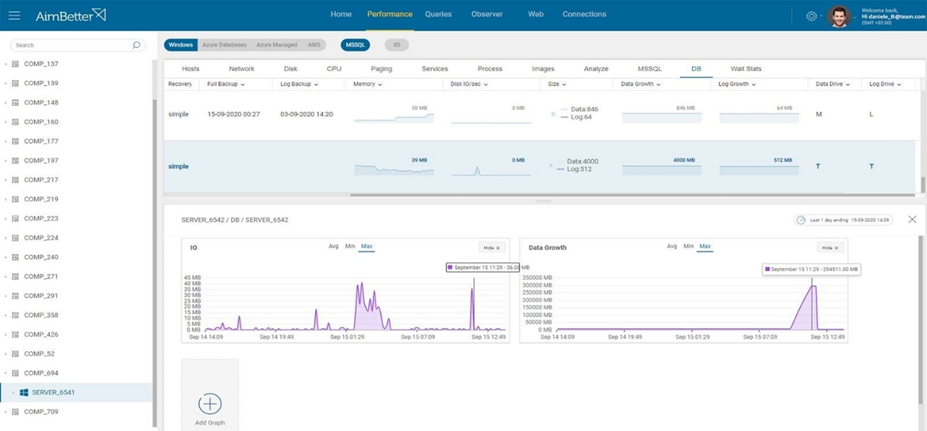
➣ DB on Windows MSSQL
Here, the individual databases under the server are represented. You can find information about the Databases, their names, recovery model, last full backup, last log backup, and more metrics in the “Columns Button.”
Click here for the description of each metric on this DB Tab.
In the following example, the “Data Growth” graph was expanded, and the IO graph was added in order to see the data growth of the specific chosen DB with its required IO per second.
➣ Wait Stats on Windows MSSQL
This tab shows the different wait types and their related information, such as wait time percentage, number of tasks in this Wait Stats category, average wait time, and more.
Click here for the description of each metric on this Wait Stats Tab.
➣ Oracle DB on Windows
For Oracle Servers, this tab will display the Oracle instance details such as the instance name, database name, log mode, last restart, the time to establish a connection, and more.
Click here for the description of each metric on this Oracle Tab.
➣ Wait Stats on Windows Oracle DB
This tab shows the different wait types and their related information, such as wait time percentage, number of tasks in this Wait Stats category, average wait time, and more.
Click here for the description of each metric on this Wait Stats Tab.
Linux Tabs
➣Hosts
This tab shows general information about the Operating System level of the selected server, such as CPU Usage percentage, Total Server Memory, how much Free Memory remains, and the server’s Last Restart.
Click here for the description of each metric on this Hosts Tab.
➣ Network
This tab shows the server’s network information, such as the Network Card details, Bandwidth, and Network Traffic levels.
Click here for the description of each metric on this Network Tab.
➣ Disk
This tab shows information about storage Disks, Used Space and Total Space, Free Space, how busy they are at any given time, Read/Write, and IO levels.
Click here for the description of each metric on this Disk Tab.
➣Swaps
This tab shows Swap information, including swaps’ file name, type, size, used space, and more.
Click here for the description of each metric on this Paging Tab.
➣ Services
This tab shows information about the services currently running, their mode (either manual or automatic), status (running or not), account, path, and more. The graph in this subtab shows either 1—Up/Running or 0—Down/Not Running over the selected period.
Click here for the description of each metric on this Services Tab.
➣Process
This tab shows information about the different processes running on the server.
You can see their CPU usage, how much memory they consume, Page file usage, details of the calling process, and more.
Click here for the description of each metric on this Process Tab.
➣ MSSQL on Linux
For MSSQL Servers, this subtab will display details about the MSSQL instance, such as the SQL version, its service pack, the last restart, the amount of memory allocated for the SQL, the number of cores available, and in use, the time to establish a connection, and more.
Scroll right to see all more metrics. Click on the Columns Button to select which metrics to display.
Click here for the description of each metric on this MSSQL Tab.
➣ DB on Linux MSSQL
Here, the individual databases under the server are represented. You can find information about the Databases, their names, recovery model, last full backup, last log backup, and more metrics in the “Columns Button.”
Click here for the description of each metric on this DB Tab.
➣ Wait Stats on Linux MSSQL
This tab shows the different wait types and their related information, such as wait time percentage, number of tasks in this Wait Stats category, average wait time, and more.
Click here for the description of each metric on this Wait Stats Tab.
➣ Oracle DB on Linux
For Oracle Servers, this tab will display the Oracle instance details such as the instance name, database name, log mode, last restart, the time to establish a connection, and more.
Click here for the description of each metric on this Oracle Tab.
➣ Wait Stats on Linux Oracle DB
This tab shows the different wait types and their related information, such as wait time percentage, number of tasks in this Wait Stats category, average wait time, and more.
Click here for the description of each metric on this Wait Stats Tab.
Azure Tabs
➣Service
This tab shows general information about the selected server’s available cloud resources and settings, such as DTU, SKU, capacity, and more.
Click here for the description of each metric on this Service Tab.
➣MSSQL on Azure
For MSSQL Servers, this subtab will display details about the MSSQL instance, such as the SQL version, its service pack, the last restart, the amount of memory allocated for the SQL, the number of cores available, and in use, the time to establish a connection, and more.
Scroll right to see all more metrics. Click on the Columns Button to select which metrics to display.
Click here for the description of each metric on this MSSQL Tab.
➣ DB on Azure MSSQL
Here, the individual databases under the server are represented. You can find information about the Databases, their names, recovery model, last full backup, last log backup, and more metrics in the “Columns Button.”
Click here for the description of each metric on this DB Tab.
➣ Wait Stats on Azure MSSQL
This tab shows the different wait types and their related information, such as wait time percentage, number of tasks in this Wait Stats category, average wait time, and more.
Click here for the description of each metric on this Wait Stats Tab.
Amazon RDS Tabs
➣Service
This tab shows general information about the selected server’s available cloud resources and settings, such as DTU, SKU, capacity, and more.
Click here for the description of each metric on this Service Tab.
➣ MSSQL on Amazon RDS
For MSSQL Servers, this subtab will display details about the MSSQL instance, such as the SQL version, its service pack, the last restart, the amount of memory allocated for the SQL, the number of cores available, and in use, the time to establish a connection, and more.
Scroll right to see all more metrics. Click on the Columns Button to select which metrics to display.
Click here for the description of each metric on this MSSQL Tab.
➣ DB on Amazon RDS MSSQL
Here, the individual databases under the server are represented. You can find information about the Databases, their names, recovery model, last full backup, last log backup, and more metrics in the “Columns Button.”
Click here for the description of each metric on this DB Tab.
➣ Wait Stats on Amazon RDS MSSQL
This tab shows the different wait types and their related information, such as wait time percentage, number of tasks in this Wait Stats category, average wait time, and more.
Click here for the description of each metric on this Wait Stats Tab.
➣ Oracle DB on Amazon RDS
For Oracle Servers, this tab will display the Oracle instance details such as the instance name, database name, log mode, last restart, the time to establish a connection, and more.
Click here for the description of each metric on this Oracle Tab.
➣ Wait Stats on Amazon RDS Oracle DB
This tab shows the different wait types and their related information, such as wait time percentage, number of tasks in this Wait Stats category, average wait time, and more.
Click here for the description of each metric on this Wait Stats Tab.
IIS Web Server Tabs
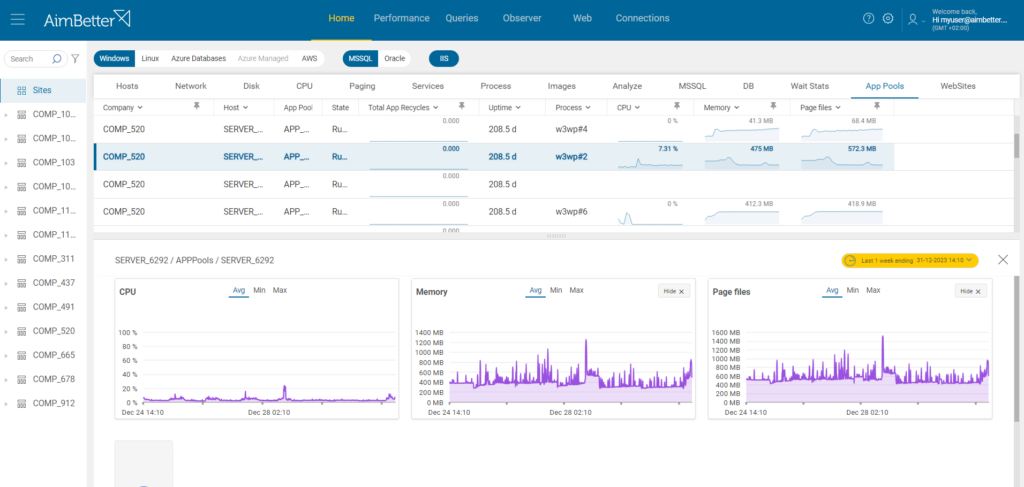
➣ App Pools
For IIS Servers, this tab shows data about the application pools’ state and usage of OS resources. Click here for the description of each metric on this App Tab.
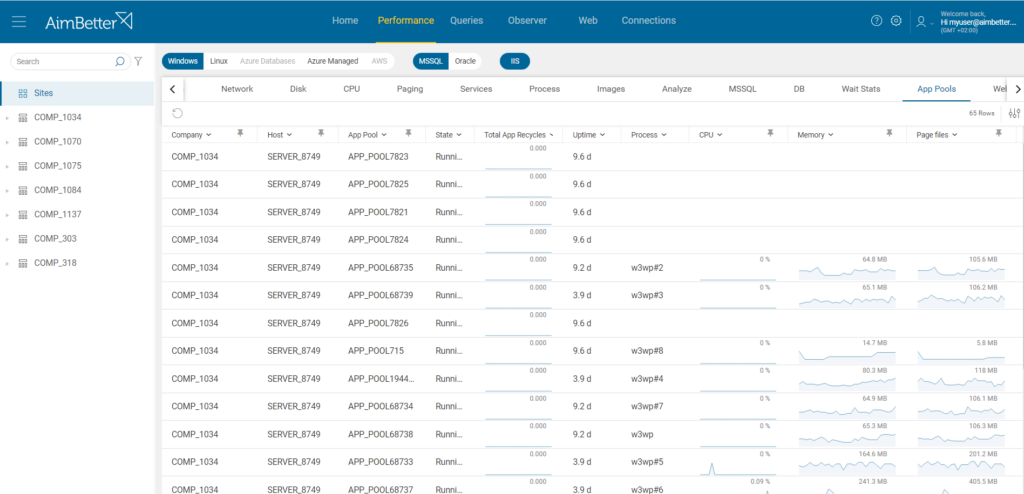
Click on any of the graphical metrics to open a graph over a period, which can be changed through the Calendar bar. It is possible to see the CPU, Memory, and Page file usage by the app pools over time and evaluate their effectiveness:
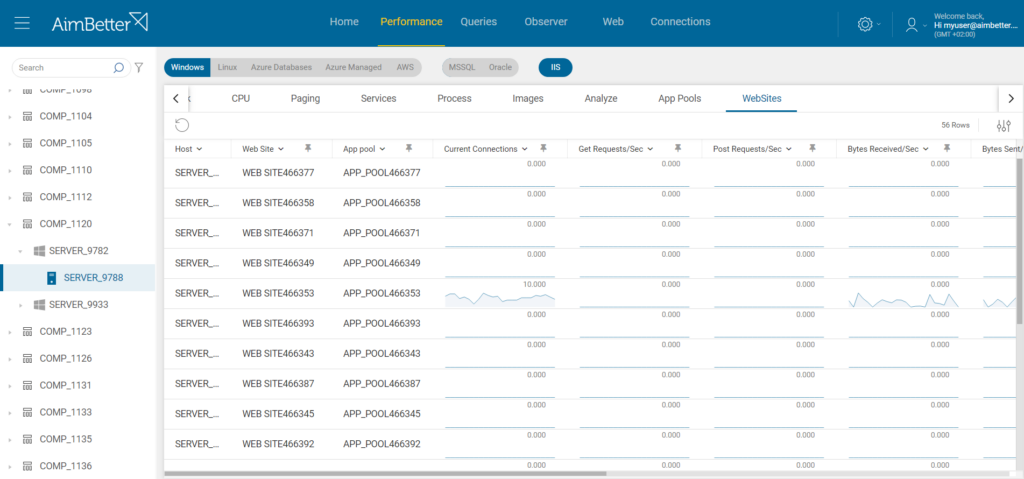
➣ WebSites
For IIS Servers, this tab will display the active websites on the app pools and data about them: Current Connections to the website, GET requests per second, POST requests per second, Bytes received per second, Bytes sent per second, Deleted requests per second, Files received per second, Files sent per second, Not Found errors per second, and Put requests per second. Click here for the description of each metric on this Web Sites Tab.

 +1 (650) 449-8622