In this Tab, you will see the information about live queries running on the system (“Live”), queries that run in some selected period (“History”), and queries’ performance analytics (“QAnalyze).
Live Queries
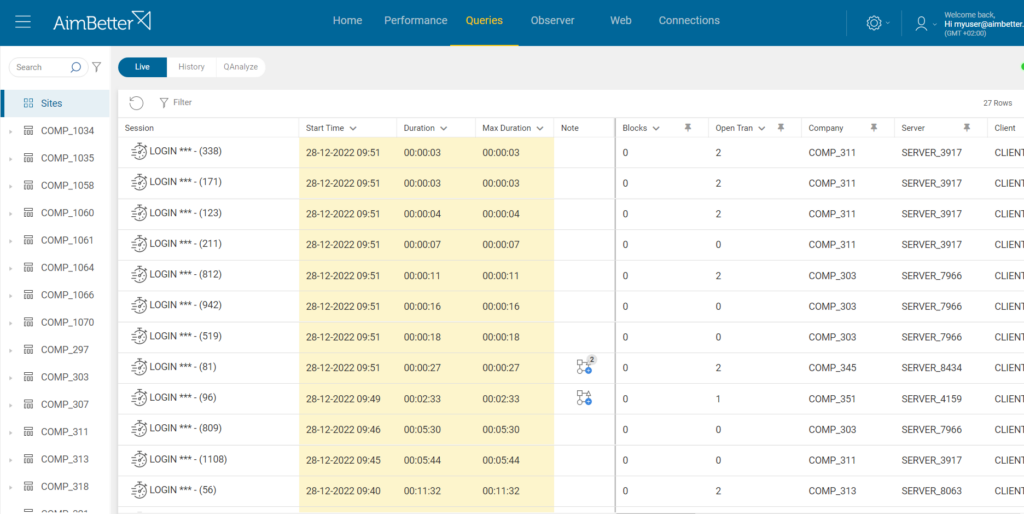
This is the first view of the Queries Tab and shows all the queries running in the selected layer that have more than 3 seconds of duration.
In the following example, the selected layer is “Sites,” which displays all the companies with all their servers.
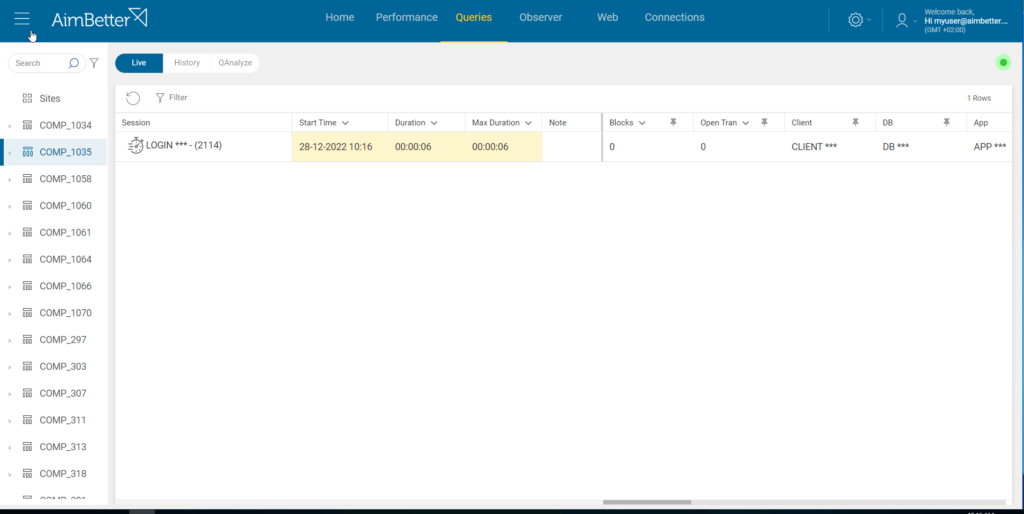
If we select on the left bar a specific company, only this company’s queries, longer than 3 seconds and running at this moment, will be displayed.
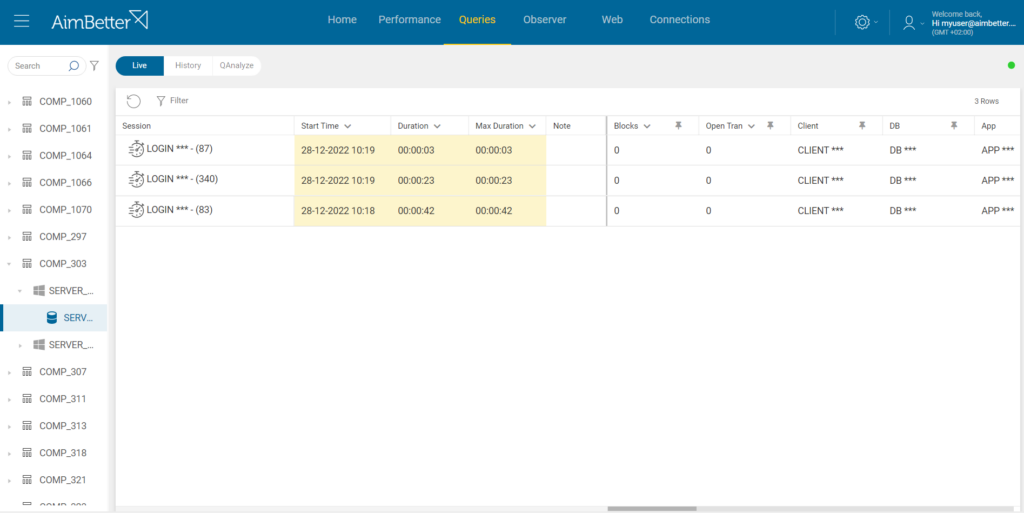
And if we want to focus only on a specific instance of a determined company, we can click on the little arrow on the left side of the company’s name, view its servers and instances, and click on the desired instance.
Kill Session
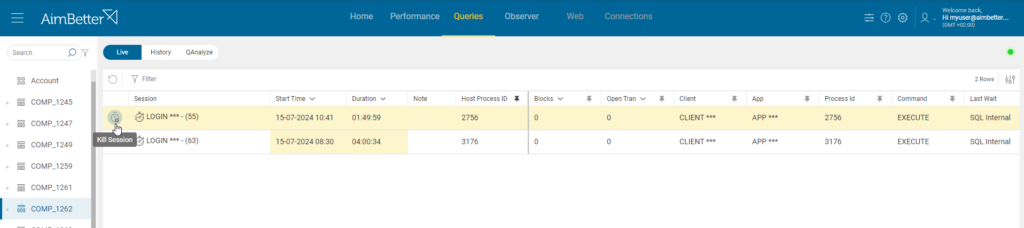
If the Responsive Agent feature is enabled, you can kill any session by clicking on the “Kill Session” icon that appears on hover on the left side of the session line.
A confirmation message will appear when clicking the “Kill Session” icon, and a code will be requested. This action is performed only if the correct code is provided.
History Queries
In the same way as in the “Live Queries,” this tab shows all the queries running in the selected layer that have more than 3 seconds of duration. The difference is that these queries, in the “History” subtab, have concluded their running cycle.
Another possibility in the “History” Queries Subtab is selecting a period in the “Calendar Bar,” as shown next.
Clicking on the “Calendar Bar,” a calendar will pop up so you may select the end time and the period to display the queries.
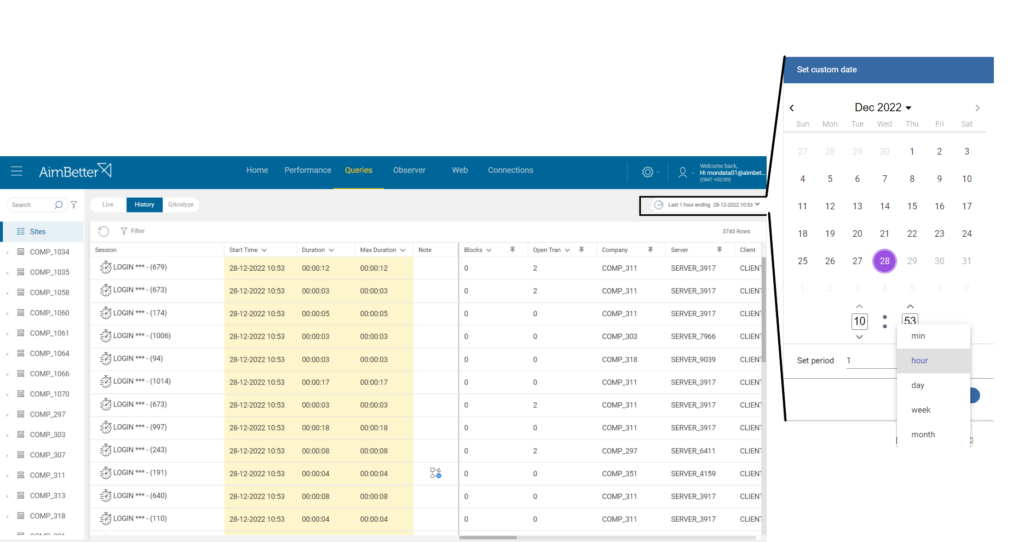
Table Settings
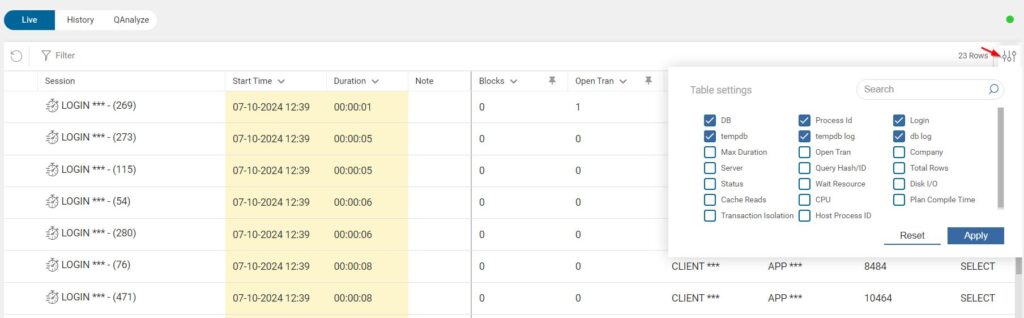
Default columns are displayed for both the “Live” Queries and the “History” Queries tabs.
You can add more columns by clicking the “Table Settings” icon at the top right and selecting the metrics you want to add. Click “Apply” to display the selected columns or “Reset” to return to the default column configuration.
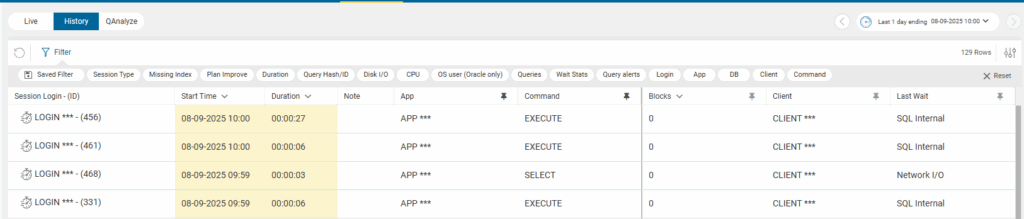
Filters
Click on the Filter icon to display the available filters.
Each filter has two options: “Set” and “Filter”.
The “Set” option is used when you want to select multiple filters. In this case, the chosen filters will be applied only after clicking the Apply button on the right side.
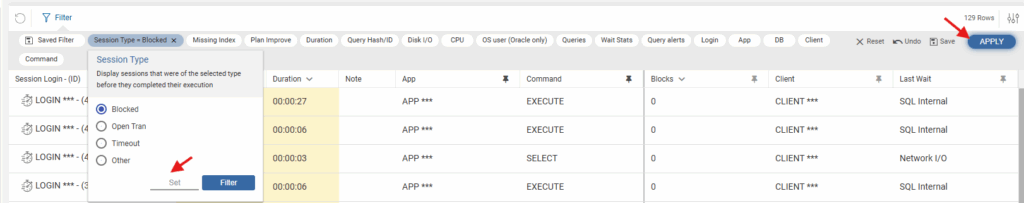
The “Filter” option will apply the filter immediately.
Note – How Queries text filter works
The Queries text filter searches by whole words or phrases.
Key points:
- Matches whole words, not partial strings.
- Special characters (like
*,,,;,:) are treated as separators or ignored. - Object names with separators (like
.) must be searched as exact phrases.
Query details
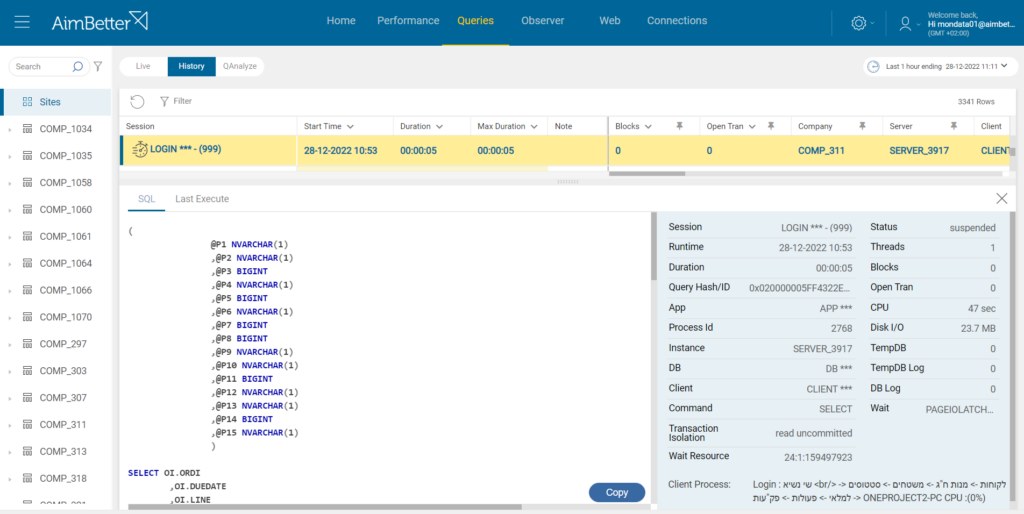
In both the “Live” Queries tab and the “History” Queries tab, each row represents a session and displays information about it like the Login, Start Time, Duration, and more.
Clicking on this row, a window will be displayed in the bottom part with more details.
On the left side of this window is the query code.
Details are displayed on the right part with the light blue background, including “Client Process,” which shows information from the client’s OS about the process that originated this query. This can be very valuable in understanding users’ practices that can be responsible for blocking or other issues.
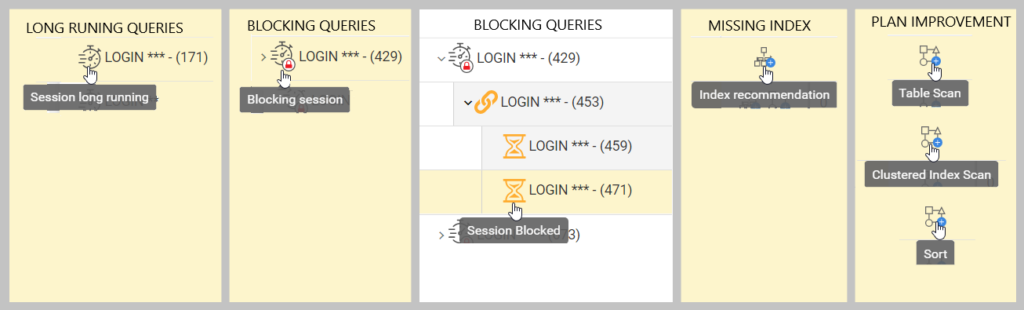
Queries Icons
There are some icons in the Queries Tab that give a quick understanding of different issues. An explanation pops up when hovering over these icons.
QAnalyze
The QAnalyze tab displays the most “costly” or “abusive” queries in terms of CPU consumption, executions, and I/O that ran in the selected period.
It also provides plan improvement or index recommendations, last execution plans with their performance details and plan execution download option.
With this information in hand, it is possible to identify which activities are the most impactful and know exactly where to focus to improve the Database performance.
By default, it displays the most impactful queries for the last 5 minutes. In the “Calendar Bar” at the top right, you can change the end time and period.
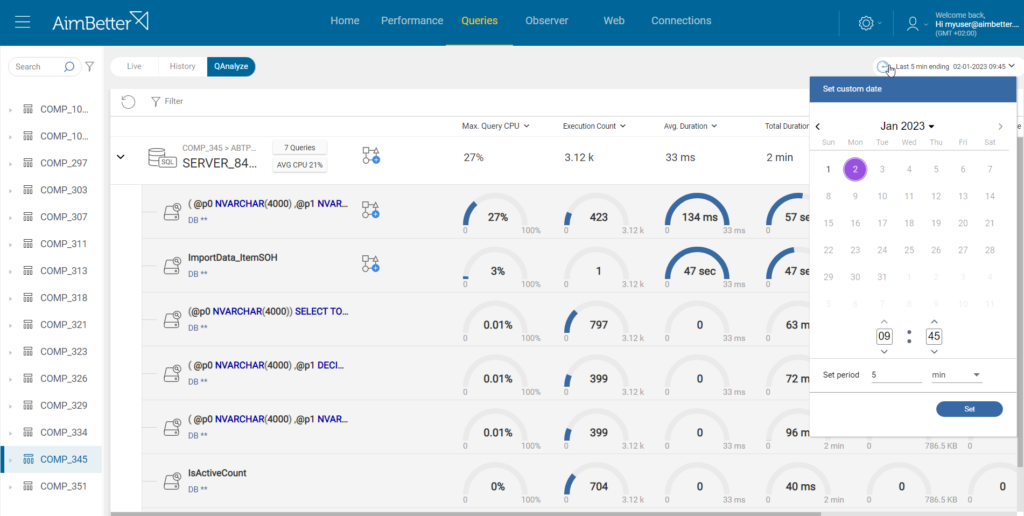
The following details are available about each one of the most impactful queries on the selected period: Maximum CPU Consumption, Execution Count, Average Duration, Total Disk Usage, Total Rows, Total Duration, Average Cache Usage, Total CPU Time, Average Disk I/O, Total Cache Usage.
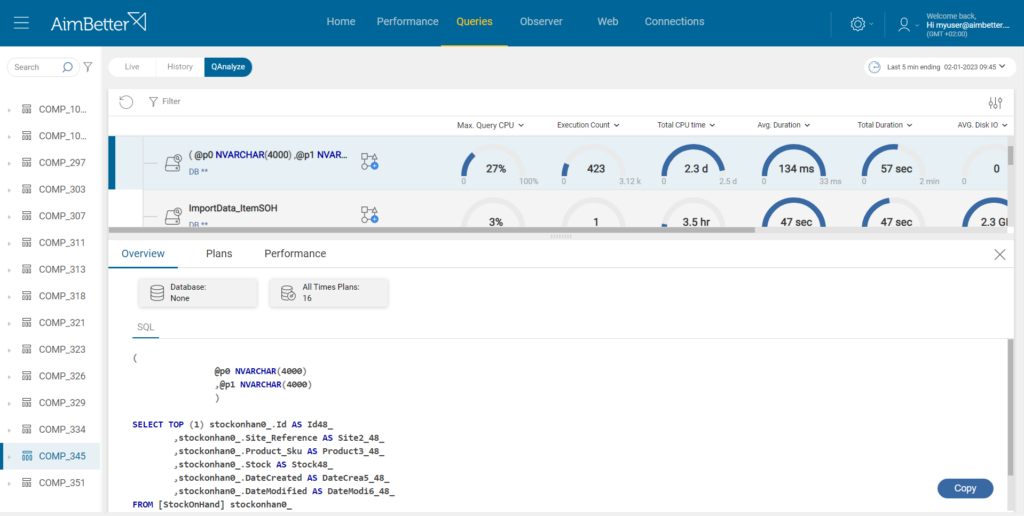
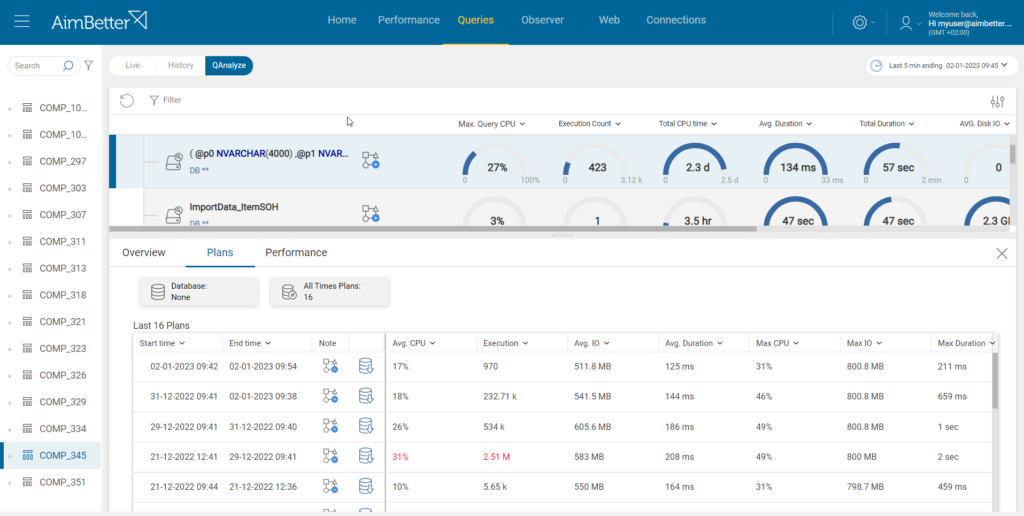
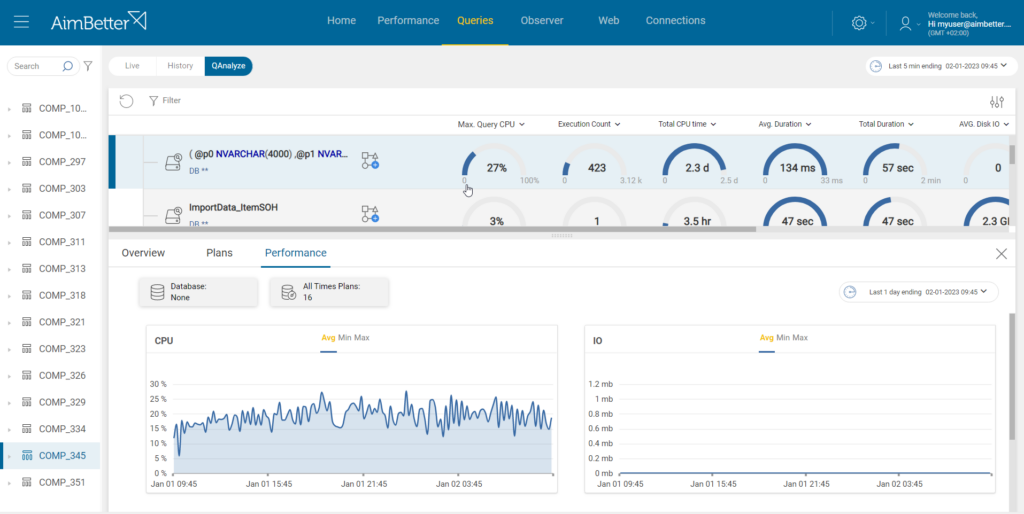
When clicking on a specific query, a window is displayed on the bottom part of the screen, showing the query script, execution plans, and performance over time.
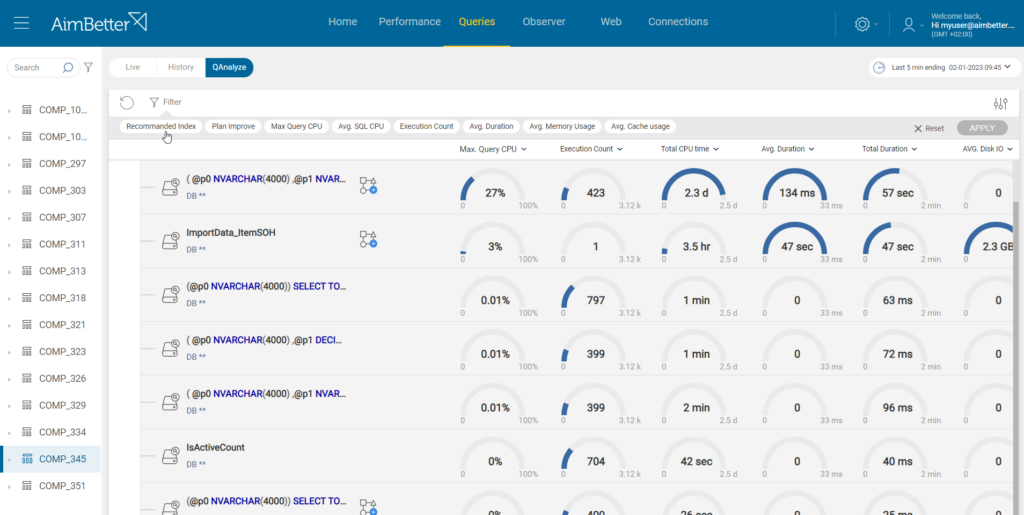
You can also filter to display only the queries with a specific condition, like those with Recommended Index, with Plan Improvement recommendation, by Execution Count, and more.
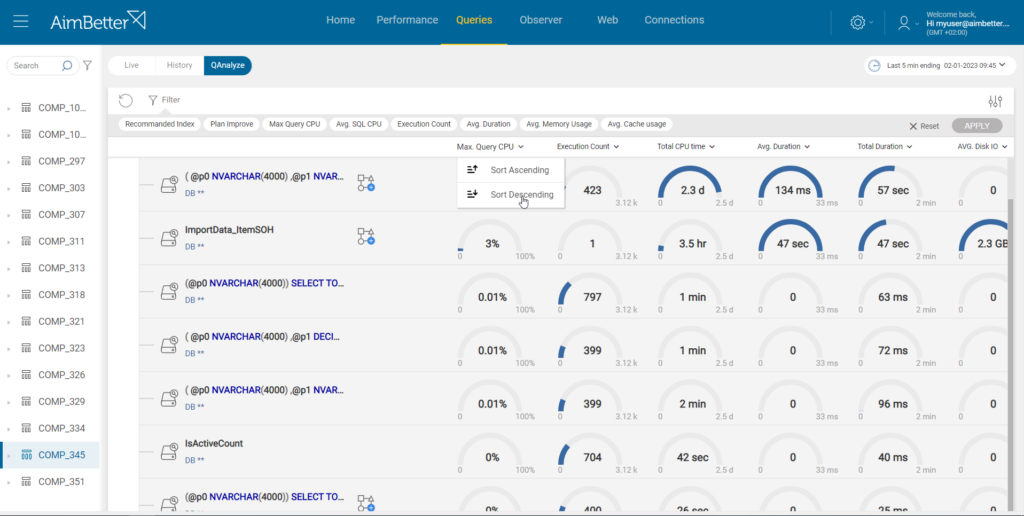
You can also sort by any one of the columns by clicking on the little arrow beside the column name. For example, sorting by the Max CPU usage:

 +1 (650) 449-8622