
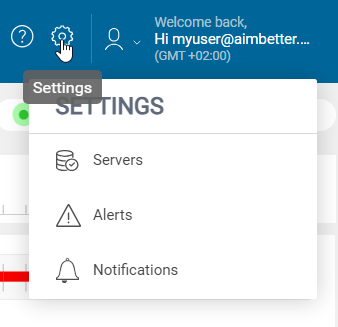
Clicking on the settings icon, you will see the following options:
1. Servers – Display and edit server details
2. Alerts– Customize alerts conditions and thresholds
3. Notifications – Add recipients for notifications and configure preferences
Servers
All the servers of the selected layer will be displayed.
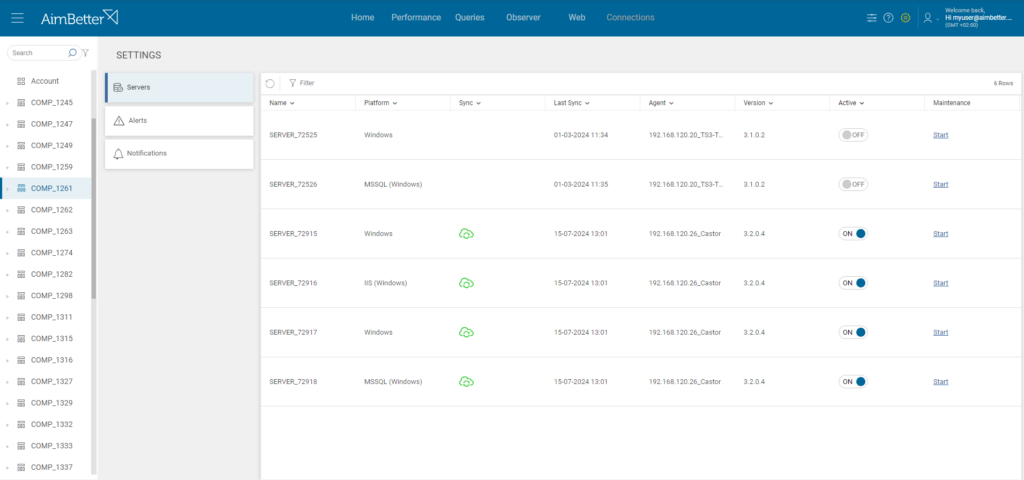
When selecting a specific company on the left sidebar tree, all the configured servers related to that company will be displayed, whether they are being monitored or not.
— Activate or Deactivate a Server
To activate a server’s monitoring, toggle the button in the “Active” column to ON. To deactivate it, toggle the button in the “Active” column to OFF.
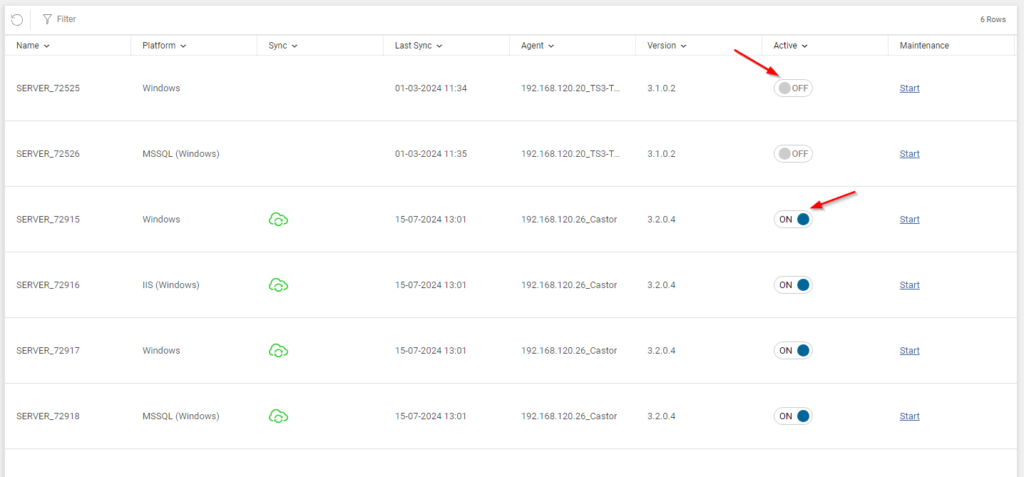
The number of active servers depends on your license agreement. Our sales team can help you with licensing at [email protected].
— Server Settings Filters
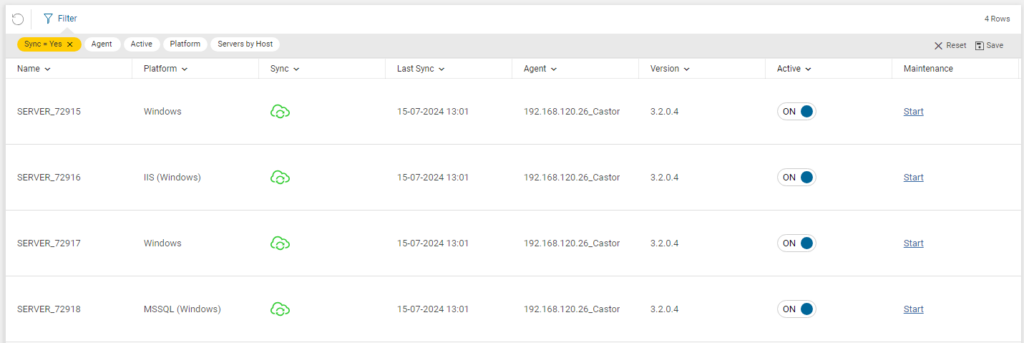
Using the following filters, you could focus on specific servers by Platform, if they are Active, and if they are “Sync.”
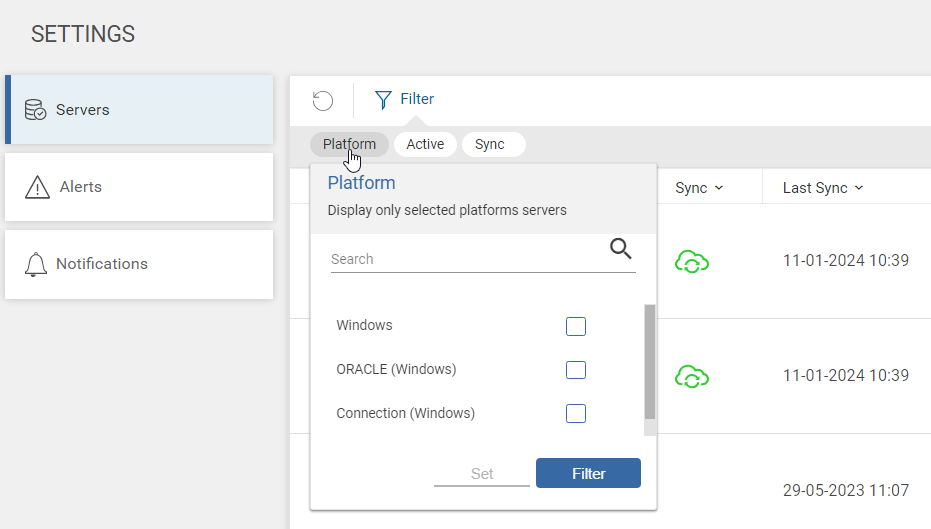
“Sync” shows the following green icon if the server was polled at the last minute. If the server was not polled at the last minute, there is no icon, and this indicates that there might be a synchronization problem with this server.
— Server Maintenance
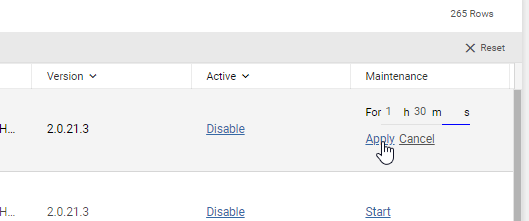
The Maintenance column is for setting a maintenance time during which you don’t want alerts emailed to a specific server. While under maintenance, the server is still monitored, and its status is still displayed in the “Home” menu. When the maintenance time frame ends, the alert emailing for that server turns back on.
From the moment the Maintenance time is set, AimBetter will countdown the time and display how much time is left until the alert emailing for that server resumes.
Alerts
The Alerts menu is where you set up the criteria for alert configuration.
Once AimBetter installation is complete, there is a default set of enabled alerts with default thresholds.
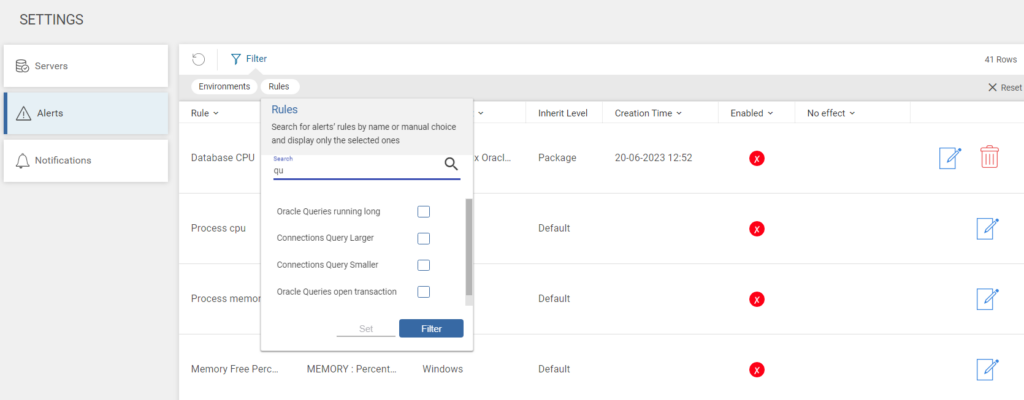
Alerts can be filtered by the alert (rule) name or environment for locating a particular rule.
You will see a list of all available alerts by clicking on Rules under Filter. Typing in Search will reduce the list to those alerts containing the typed text.
You may opt to disable some default alerts by clicking on the red trash icon at the end of the row. Some alerts that don’t have the red “trash” icon cannot be disabled this way.
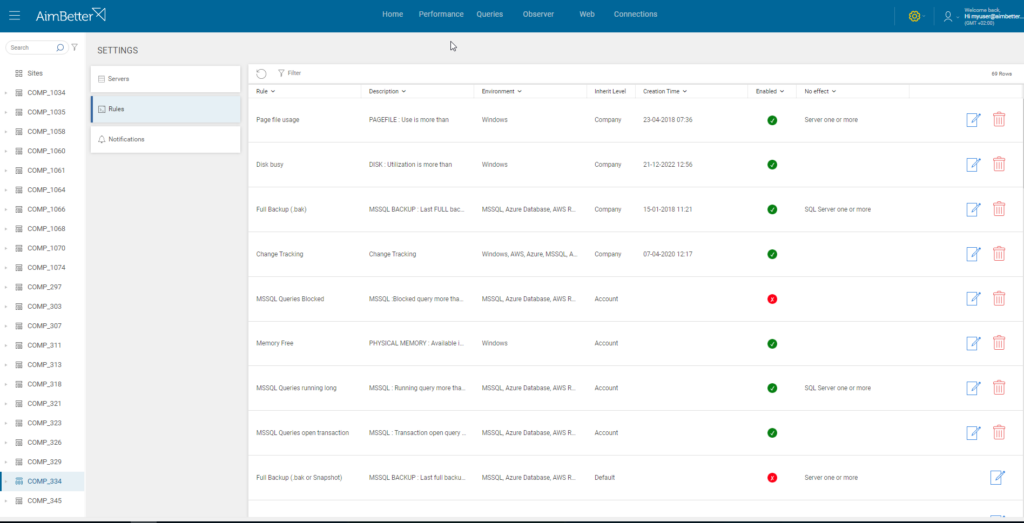
You can also edit the thresholds for each alert by clicking on the blue “edit” icon at the end of the row.
In the configuration window of the alert, you may also disable it by turning the button off.
Once an alert is edited- the “Inherit” level of a column will be changed from default to the chosen alert level, and the creation time will also be updated. To choose the alert level, click on the Company, Host, or Server to which you intend to configure this alert. All the lower levels will inherit the same configuration.
— Performance Metrics Alert Configuration
The configuration for alerts related to performance metrics with a numeric representation – either absolute or in percentage – such as CPU, Memory, and likewise, is as follows:
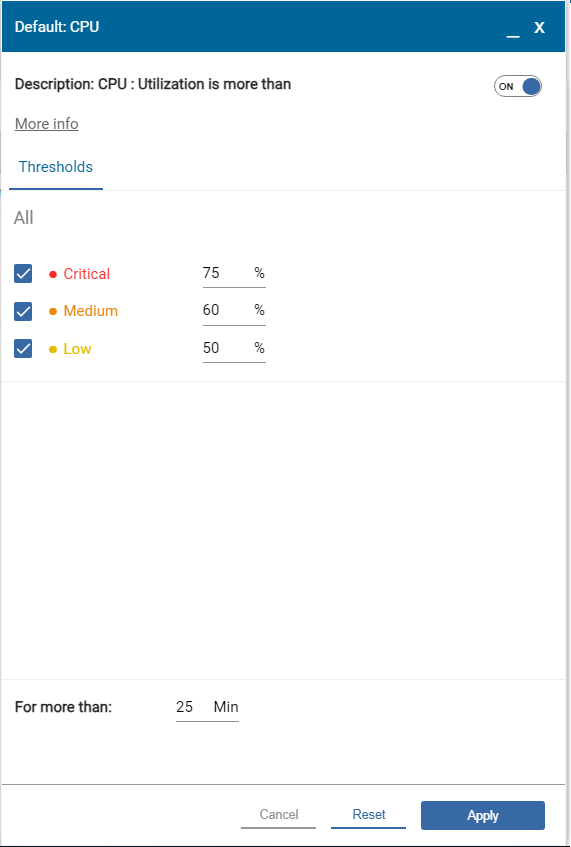
Besides each severity level (Critical, Medium, and Low), you may insert the threshold value. It is also possible to disable a severity level by unchecking the check box before it.
On the bottom, beside the “For more than,” you should insert the period in which the alert metric should be continuously above the threshold defined for each severity level. For example, as in the following image, the period inserted was 25 minutes, and the Critical threshold defined was 75%. The system will send a “Critical” alert (coloring the bar in the Home tab in red) only if it measures above 75% for 25 minutes continuously – 25 measurements every minute.
After any changes, click on “Apply” to save them.
— Performance Metrics with Specific Cases Alert Configuration
For some performance metrics alerts, there is an option to set different thresholds for specific cases from the default, which is set under the “All” label.
For this customized setting, it is necessary to select the server level and then click on the Add link at the bottom of the configuration window.
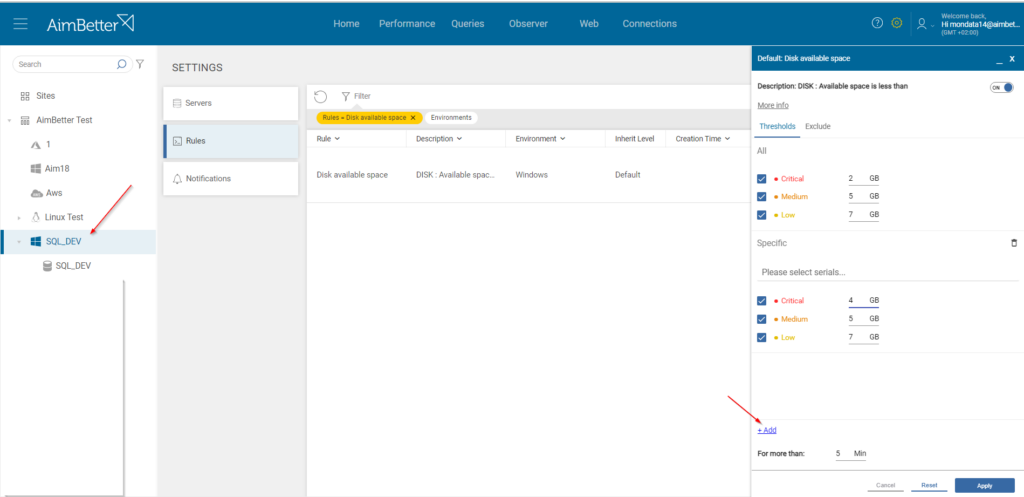
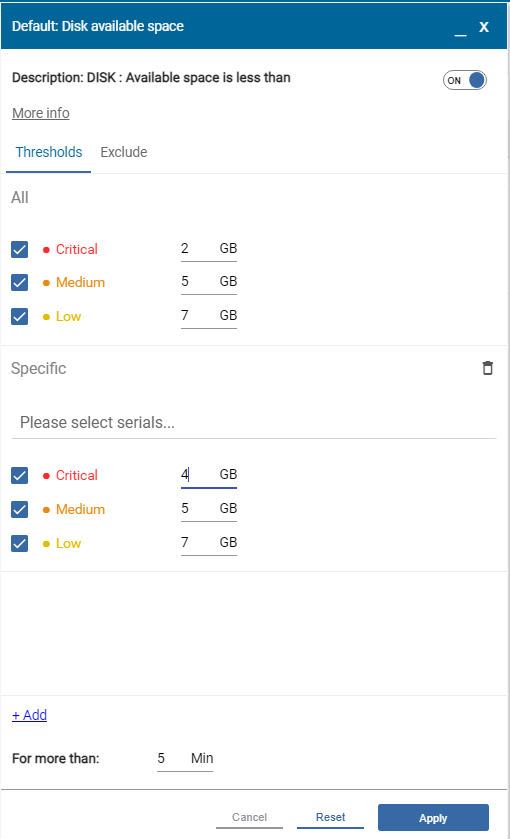
Under the “Specific” label, you can enter a text that identifies the serial that will be configured with a different threshold than the default. For example, in the “Disk available space” alert, you can add a different threshold for specific Drives by entering the drive letter and adding the threshold values beside each severity level.
Serials without specification will have the top-level (Critical) implemented.
It is also possible to exclude a specific serial from this performance metric alert. For that, click on the “Exclude” label beside “Thresholds” and insert the serials to be excluded from this alert notification. In this case, there will be no notification at all about the performance metric for the excluded serials.
After any changes, click on “Apply” to save them.
— Queries Alert Configuration
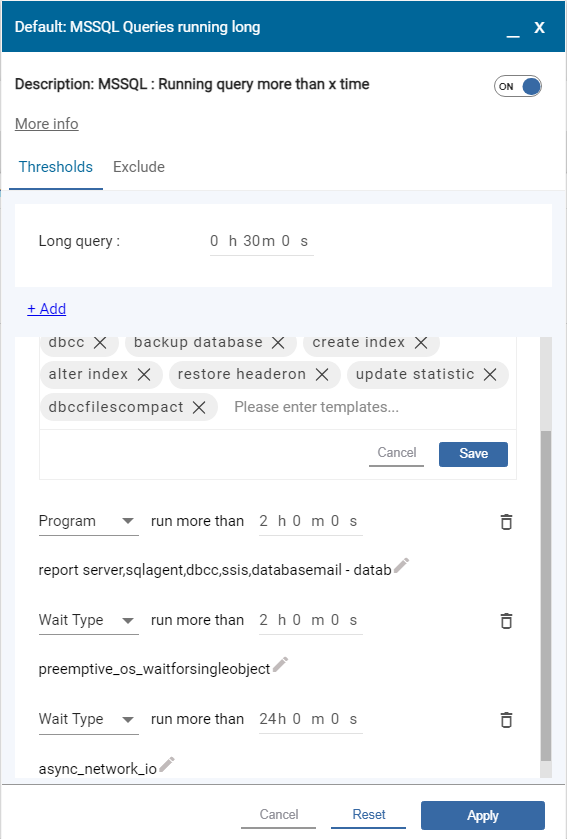
Alerts related to query conditions require a single default threshold and are sent whenever the threshold is transpassed.
Notice that these alerts are blue-colored in the Home Tab status bar.
It is possible to add different thresholds for specific queries by the following criteria:
- Query – queries with a specific code
- Commands – queries that include specific SQL commands
- Program – queries from specific programs/apps
- Wait type – queries with specific wait types
- Database – queries from specific Databases
It is also possible to exclude specific queries from this query alert. For that, click on the “Exclude” label beside “Thresholds” and insert the queries by criteria as explained above. In this case, there will be no notification at all about the query condition of this alert for the excluded queries.
After any changes, click on “Apply” to save them.
— Missing Backup Maintenance Alert Configuration
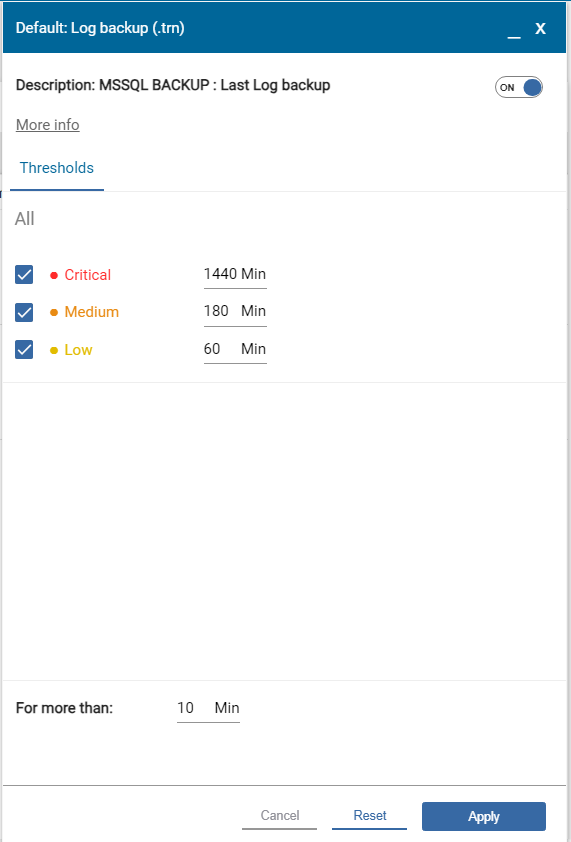
For Alerts related to missing backup maintenance, besides each severity level (Critical, Medium, and Low), you should insert the acceptable time from the last successful backup of this alert.
The period defined at the bottom – “For more than __ minutes” – relates to the tolerance from the moment the missing backup is detected until the alert is activated.
After any changes, click on “Apply” to save them.
— Failure Events Alert Configuration
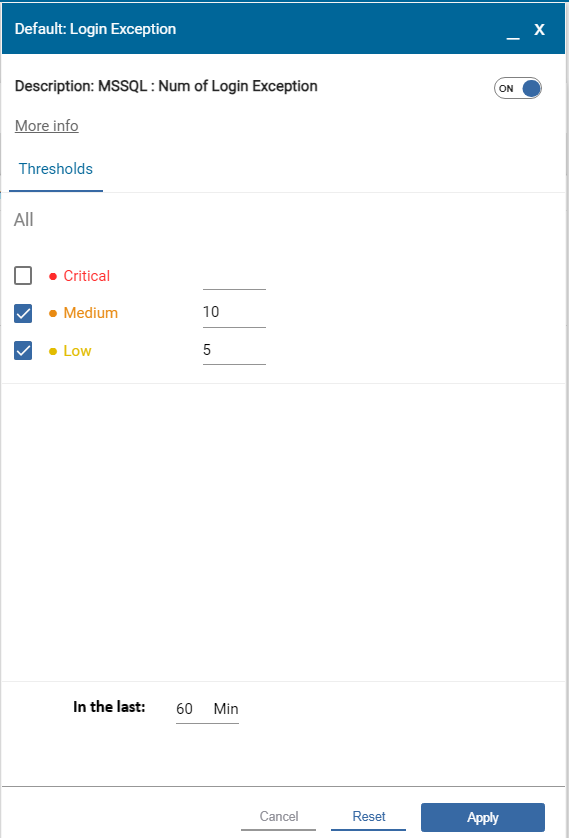
For Alerts related to failure events, besides each severity level (Critical, Medium, and Low), you should insert the threshold value, which is the number of events of this kind that can happen in the period defined at the bottom- “In the last __ minutes”.
It is also possible to disable a severity level by unchecking the check box before it.
Notice
From the moment the alert is triggered, an email notification is sent, and while the condition that triggered the alert persists—i.e., the number of events of this kind in the last set period is above the threshold—the system won’t send more e-mail notifications on this subject, although additional occurrences of this failure may occur.
If the number of events lowers under the threshold for at least a minute, the next time it transpasses the threshold again, an e-mail notification will be sent.
After any changes, click on “Apply” to save them.
— Status Alert Configuration
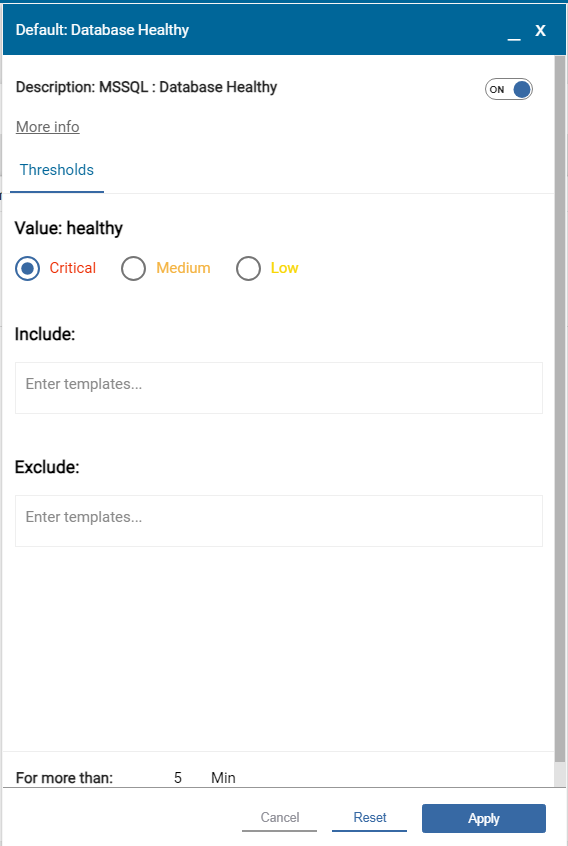
These alerts relate to some Database status and have no threshold. The alert is sent when the defined status is identified if this alert is active.
It is possible to define the severity level of this alert and include or exclude specific Databases from it.
After any changes, click on “Apply” to save them.
— Service Not Running Alert Configuration
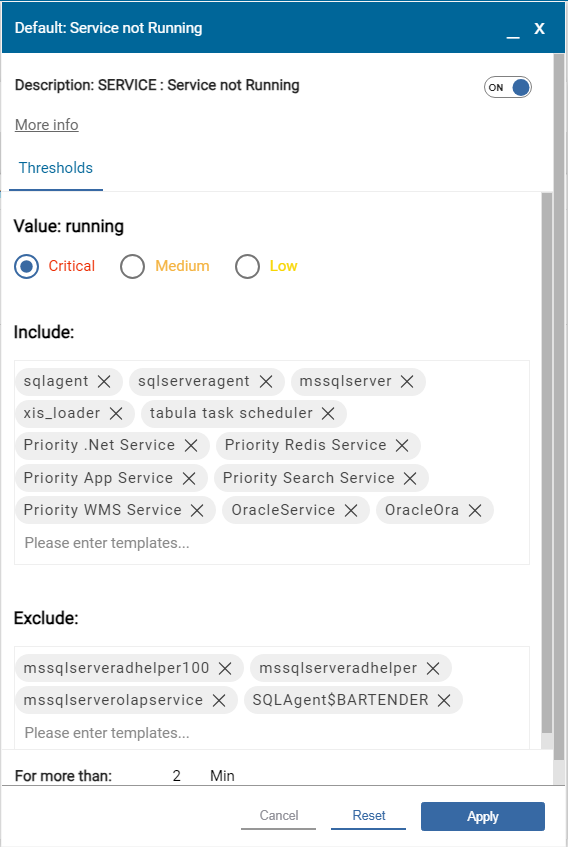
This alert relates to specific services for which it is important to know they stopped running for more than a defined period, inserted at the bottom of the configuration window beside the “For more than:” label.
It is possible to define the severity level of this alert and include or exclude specific services by typing the text that these services’ names should contain.
Only included services that stopped running for more than the defined period are alerted – not any other service.
The excluded list is for excluding services whose name contains the name of some included service. For example, the “sqlserver” service is included, but the “mssqlserveradhelper” should be excluded, as in the image below.
After any changes, click on “Apply” to save them.
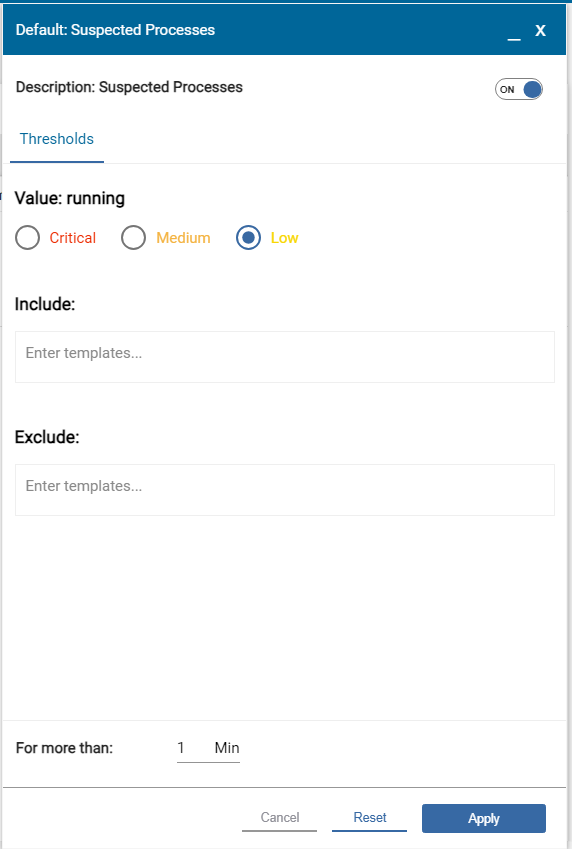
— Suspicious Process Alert Configuration
This alert relates to specific processes for which it is important to know they are active for more than a defined period, inserted at the bottom of the configuration window beside the “For more than:” label.
It is possible to define the severity level of this alert and include or exclude specific processes by typing the text that these services’ names should contain.
Only included processes running for more than the defined period are alerted – not any other process.
The excluded list is for excluding processes whose name contains the name of some included process.
After any changes, click on “Apply” to save them.
— Change Tracking Alert Configuration
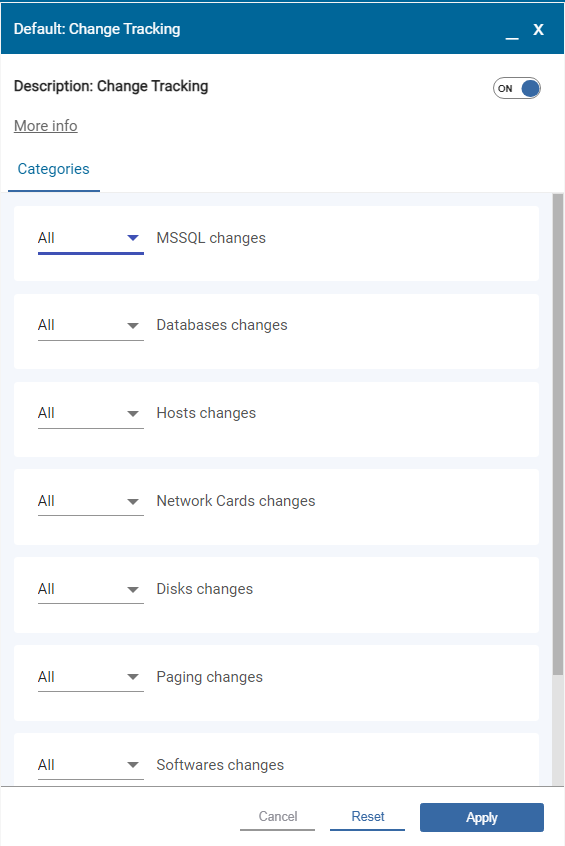
This alert relates to relevant-to-know changes in the following layers: MSSQL, Database, Host, Network, Disk, Paging, Software, and Services.
For each layer, you can select to receive notifications about all changes in this category by choosing “All”.
It is also possible to select only specific changes in each layer by choosing “Specific” and typing the text identifying the changes to be notified about.
Another option is to select all changes, excluding specific ones in each category, by choosing “Exclude” and typing the text identifying the changes to be ignored (not notified about).
After any changes, click on “Apply” to save them.
Notifications
Notifications let you set the recipients of automated alert emails.
The default recipient is the user’s email. You can add other recipients and customize which alerts these recipients will receive.
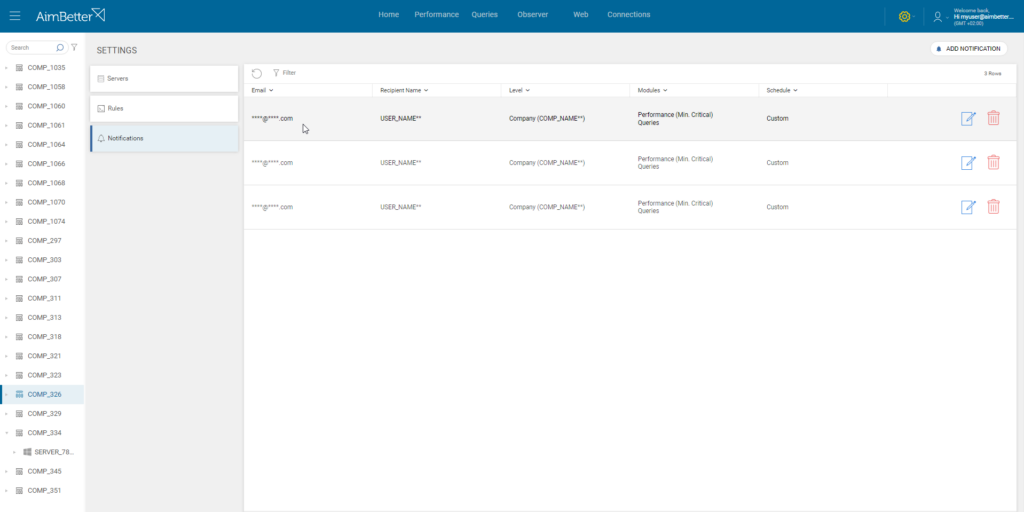
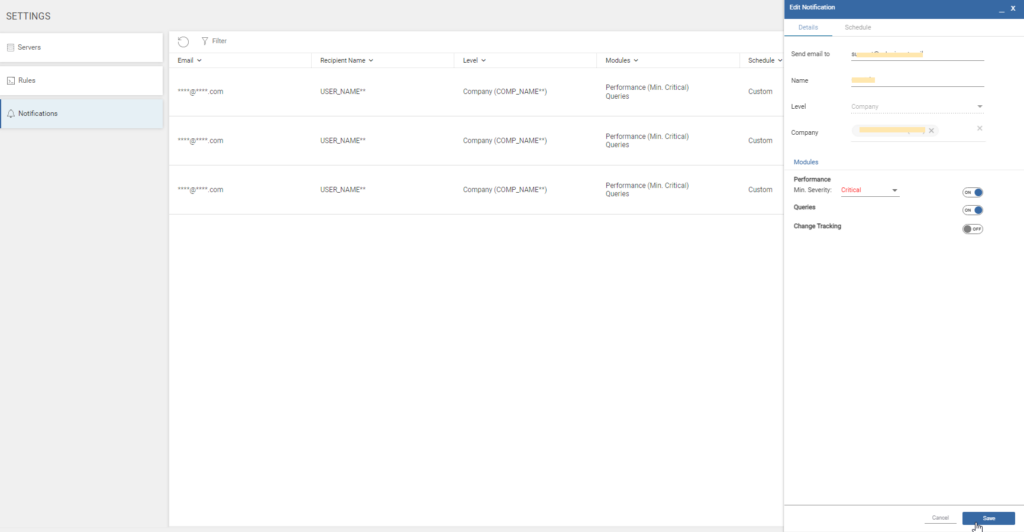
For each recipient, you may define which level of alerts they will receive: Account, Company, Server, or Database. The Account level is the most comprehensive one and can include many Companies. Next is the Company level, which can include many Servers, followed by the Server level, which can include many Databases. The most specific level is the Database.
It is also possible to limit the alert sending to only specific modules: “Performance”, “Queries”, and “Change Tracking”. You can also set the severity level for the “Performance” model.
Finally, you can define the notification period in the “Schedule” tab next to “Details.”
The default configuration is for receiving every day – all days are active (in yellow) – all times, from 00:00 until 23:59.
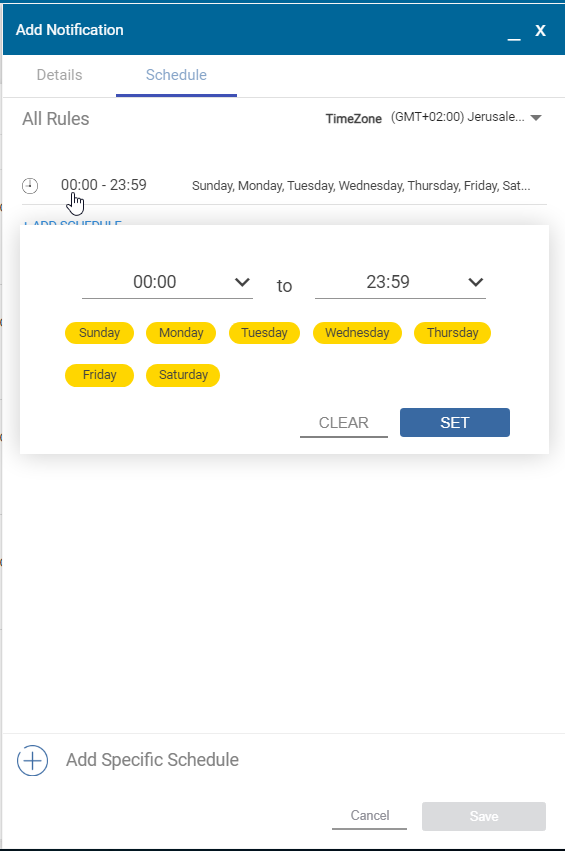
Notice: If all the weekdays are deactivated, this recipient won’t receive any alert.
If an alert is raised outside the scheduled time, the recipient won’t be notified by e-mail and will see the alert only on the Home tab of the AimBetter UI.
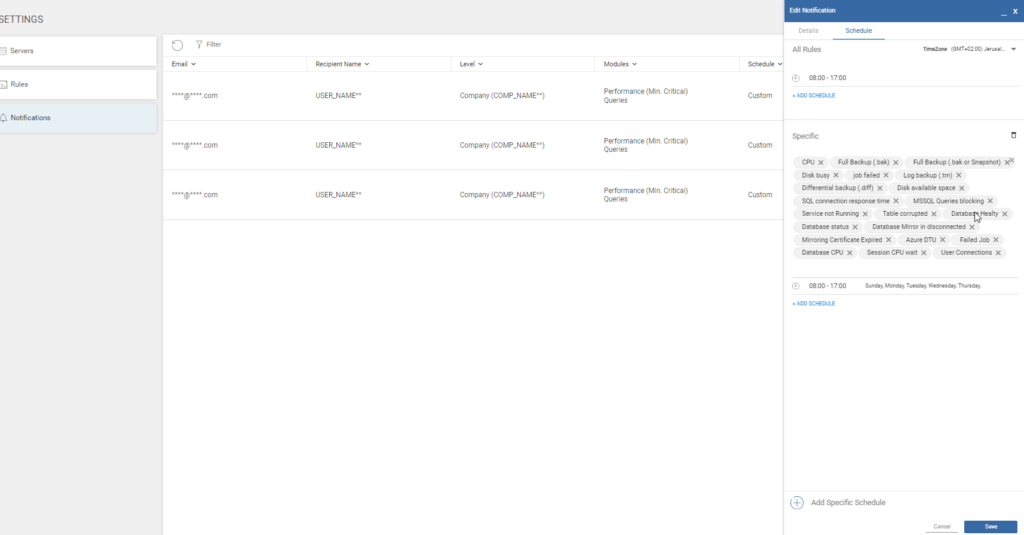
This schedule can be set for all alerts or specific alerts under the “Specific” label.
Notifications Issues
Important Notice
When you schedule a notification for a limited period, any alert raised beyond that period will not be sent by email and will only appear on the AimBetter UI home screen.
The same applies to any limitation of the Notification settings.
Please refer to the detailed guide above for the Notification settings.
Reports
Report Settings
The Report Settings tab lets you create and manage automated email reports that provide a summary of alerts for selected Accounts, Packages, or Servers.
Each report can be configured with its own recipients, schedule, reporting period, and scope.
Report Settings Table
The Report Settings table displays all configured reports and lets you activate, edit, or delete them.
The table includes:
- Report Name – The name assigned to the report.
- Schedule – Shows the reporting period (for example, the last 24 hours) and the time at which the report is sent.
- Recipient Name – Displays the names of the report recipients.
- Email – Displays the recipient email addresses. Up to three email addresses can be configured for each report.
- Level – Shows the scope of the report: Account, Package, or Server.
- Last Sent – Displays the date on which the report was last sent.
- Activation – Use the toggle to activate or deactivate automatic report sending.
- Delete – Deletes the report after confirmation.
- Edit – Opens the report settings for editing.
Creating or Editing a Report
Click Add Report or the Edit icon to open the report settings.
Details – Defines what the report contains, its scope, recipients, and schedule.
- Type – Select the report type. Currently, the available type is Alert Summary. Additional report types may be added in future releases.
- Level – Select the level for which the report should be generated:
- Account – Includes alerts from the selected Account. If you have access to only one Account, it is selected automatically and cannot be cleared.
- Package – Includes alerts from one or more Packages within the selected Account. All Packages in the selected Account are selected by default. Use the search box to dynamically filter Packages by name. You can select or clear all Packages displayed in the search results.
- Server – Includes alerts from one or more Servers. Servers can be filtered by Package. Use the search box to dynamically filter Servers by name. You can select or clear all Servers displayed in the search results.
- Name – The report name is generated automatically based on the selected Account. You can edit the name to make it more meaningful or specific to your report.
- Send email to – Enter up to three email addresses to receive the report. If you need more recipients, create a group email to include them.
- Schedule – Define when the report should be generated and which period it should cover. For example, you can configure a report to be sent every weekday at 08:00 and include alerts from the previous 24 hours.
- Time Zone – Select the time zone used for the report schedule.
- Time – Define the time at which the report is sent. For example: Send Daily at 08:00.
- Period – Select how many hours of alert data should be included in the report, from 1 to 24 hours.
- Days – Select the days on which the report should be sent. By default, all days are selected. Selected days are displayed with a yellow background. Click a day to deactivate it; inactive days are displayed with a light grey background.
Advanced – For controlling which alerts are included in the report. By default, all alerts are included. You can use the search box to find rules you are interested in and unselect any alert you don’t want to include in the report.
Test Report – Use the Test button to generate and send the report immediately using the current settings. This allows you to verify the report content and recipients without waiting for the scheduled sending time.
Activating and Deactivating Reports
Use the Activation toggle in the Report Settings table to enable or disable automatic report sending.
When you deactivate a report, its configuration is retained, but it is not sent according to its schedule. You can activate it again at any time.
Deleting a Report
Click the Delete icon to remove a report.
A confirmation message appears asking you to confirm the deletion before the report is permanently removed.

 +1 (650) 449-8622