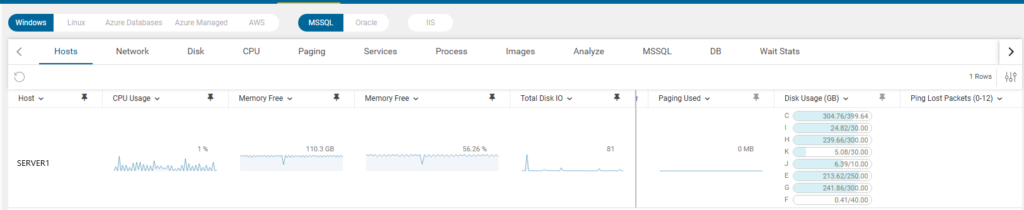
When the agent is installed on multiple servers (each with a different IP), and monitoring for a specific server is enabled on both, the graphs in the Performance module may show numerous spikes, as illustrated in this image:
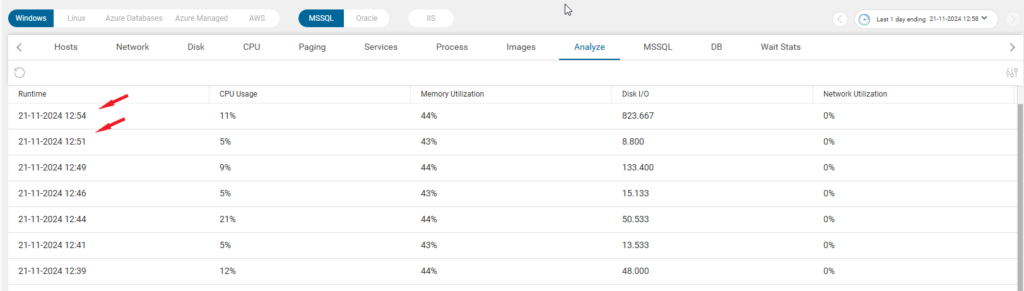
Another impact of duplicate monitoring appears in the Analyze tab, where the time intervals between logs will be shorter than the standard 5 minutes.
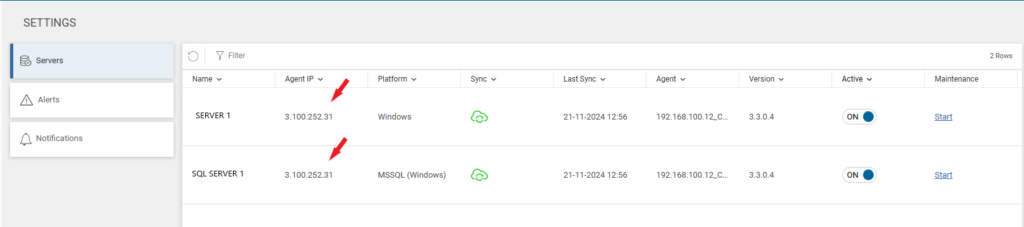
To locate the different IPs where the agent is installed, navigate to the Server Settings tab and check the value in the Agent IP column.
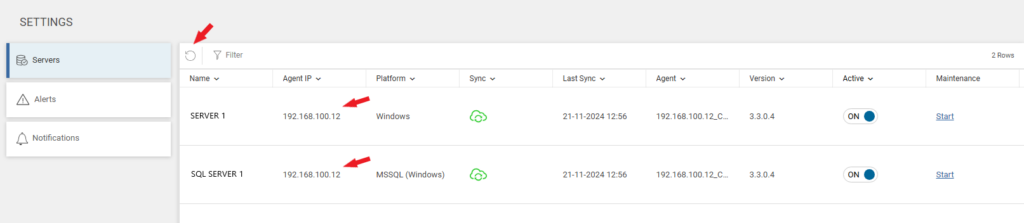
Wait for one or two minutes, then click the refresh icon. If the Agent IP value changes, the new value represents the second IP.
To solve this problem of duplicated monitoring, disable the monitoring of this server from one of the two agents.

 +1 (650) 449-8622